

Century 21 People’s Choice Realty Inc., Brokerage
120 MATHESON BLVD E #103
MISSISSAUGA, Ontario
L4Z 1X1


Toronto, Mount Dennis, M6N 4N4
$898,000
Listed by ROYAL LEPAGE SUPREME REALTY.
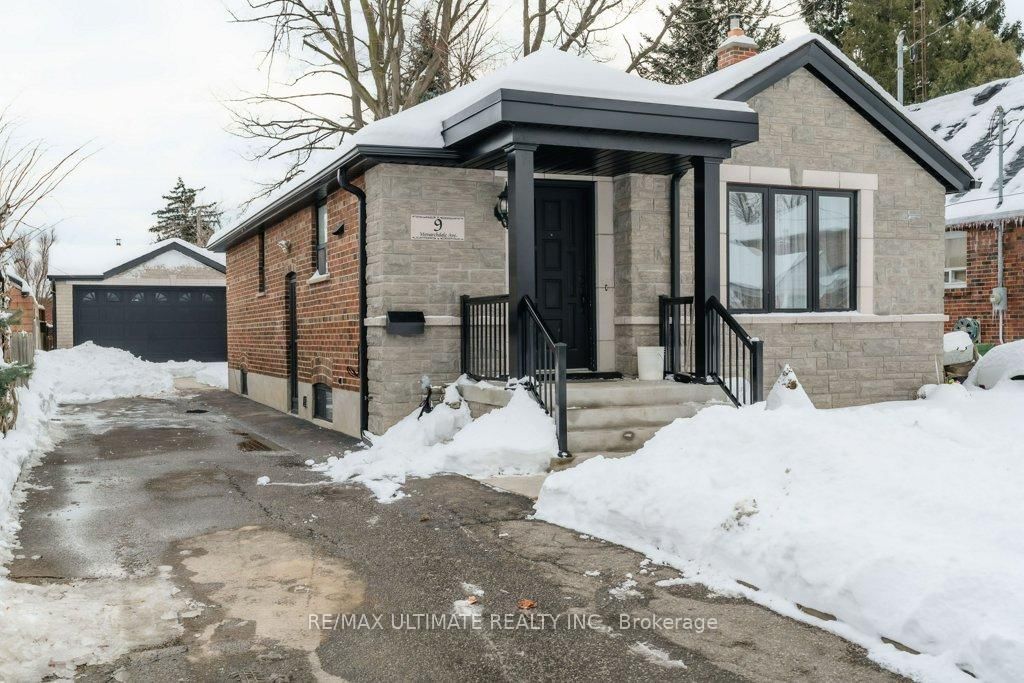
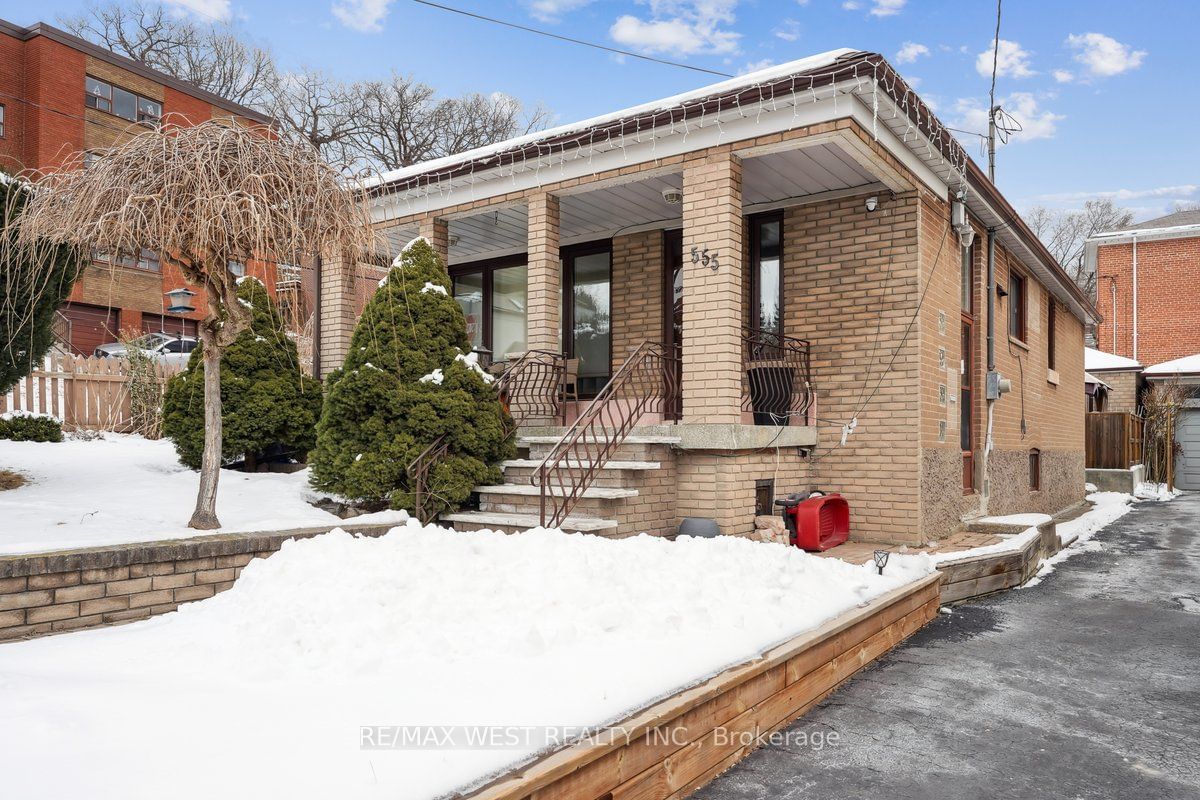
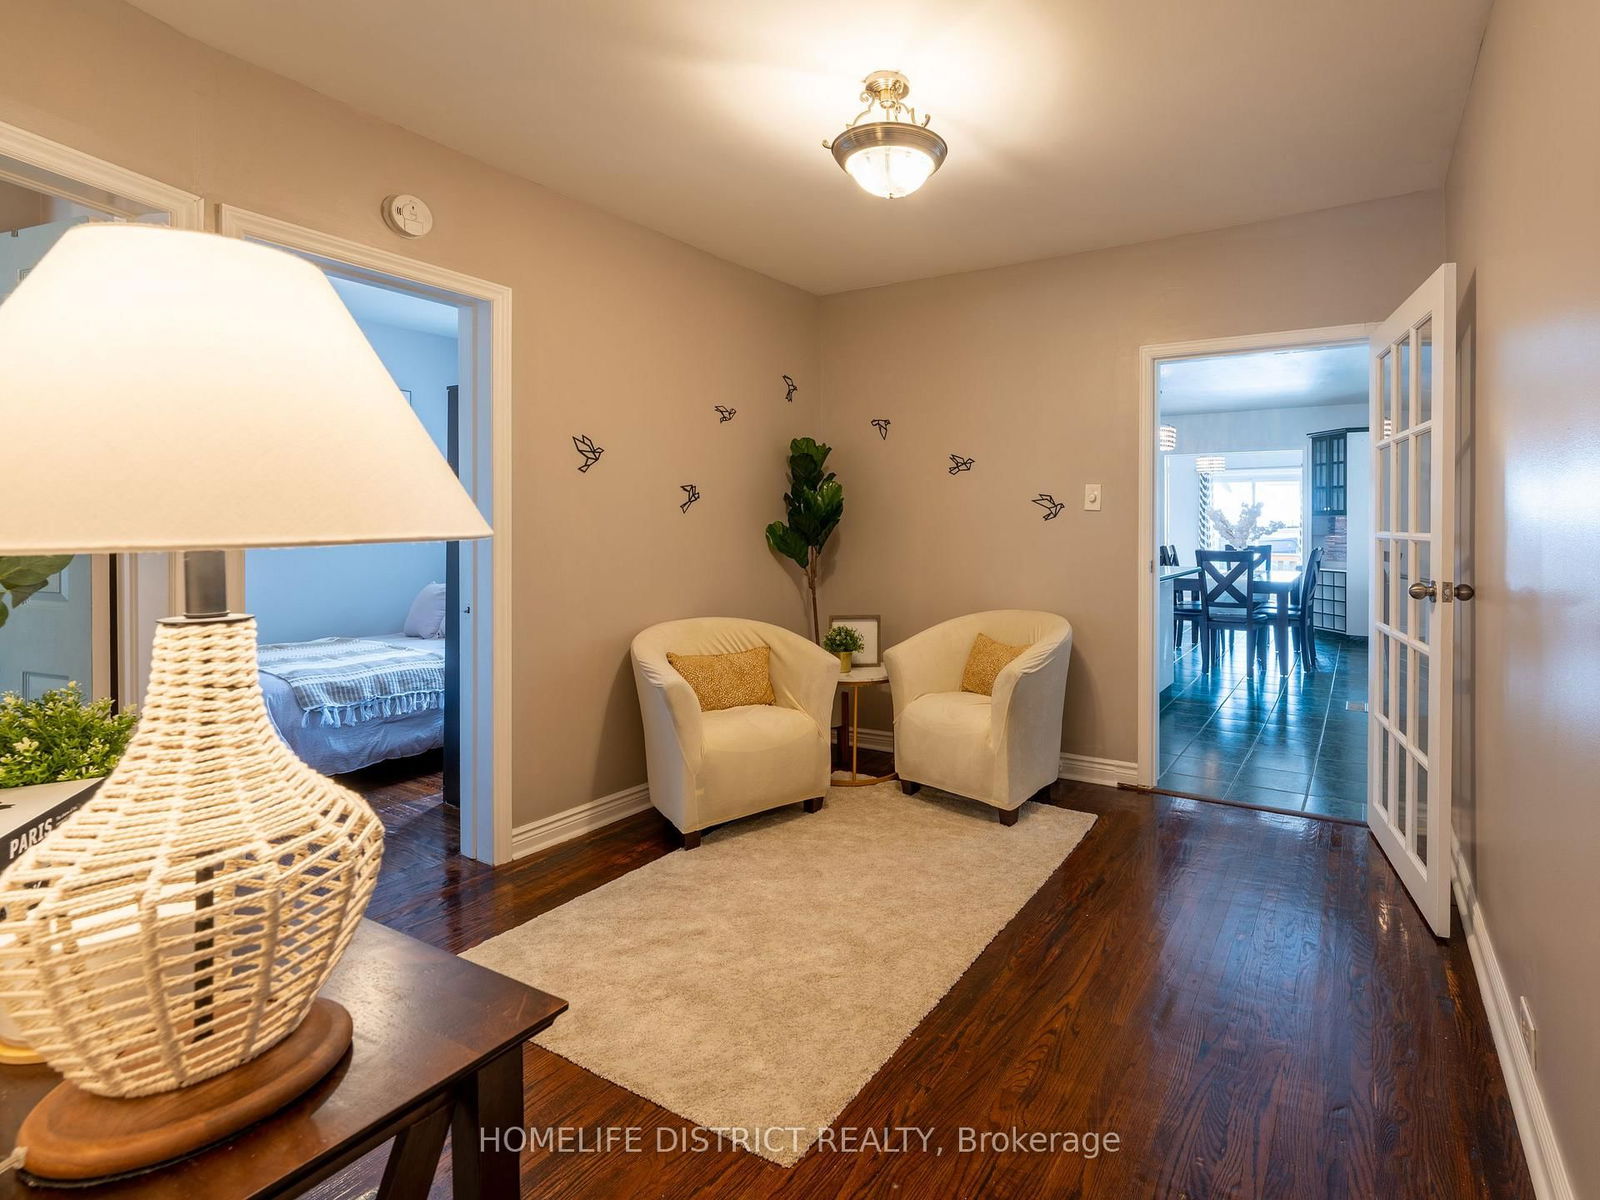
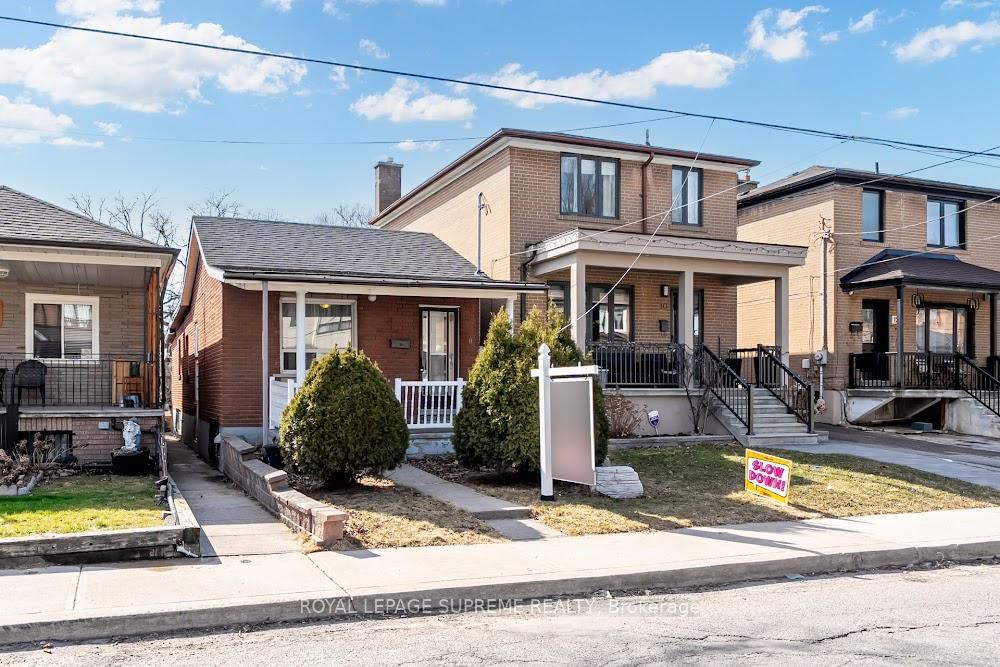
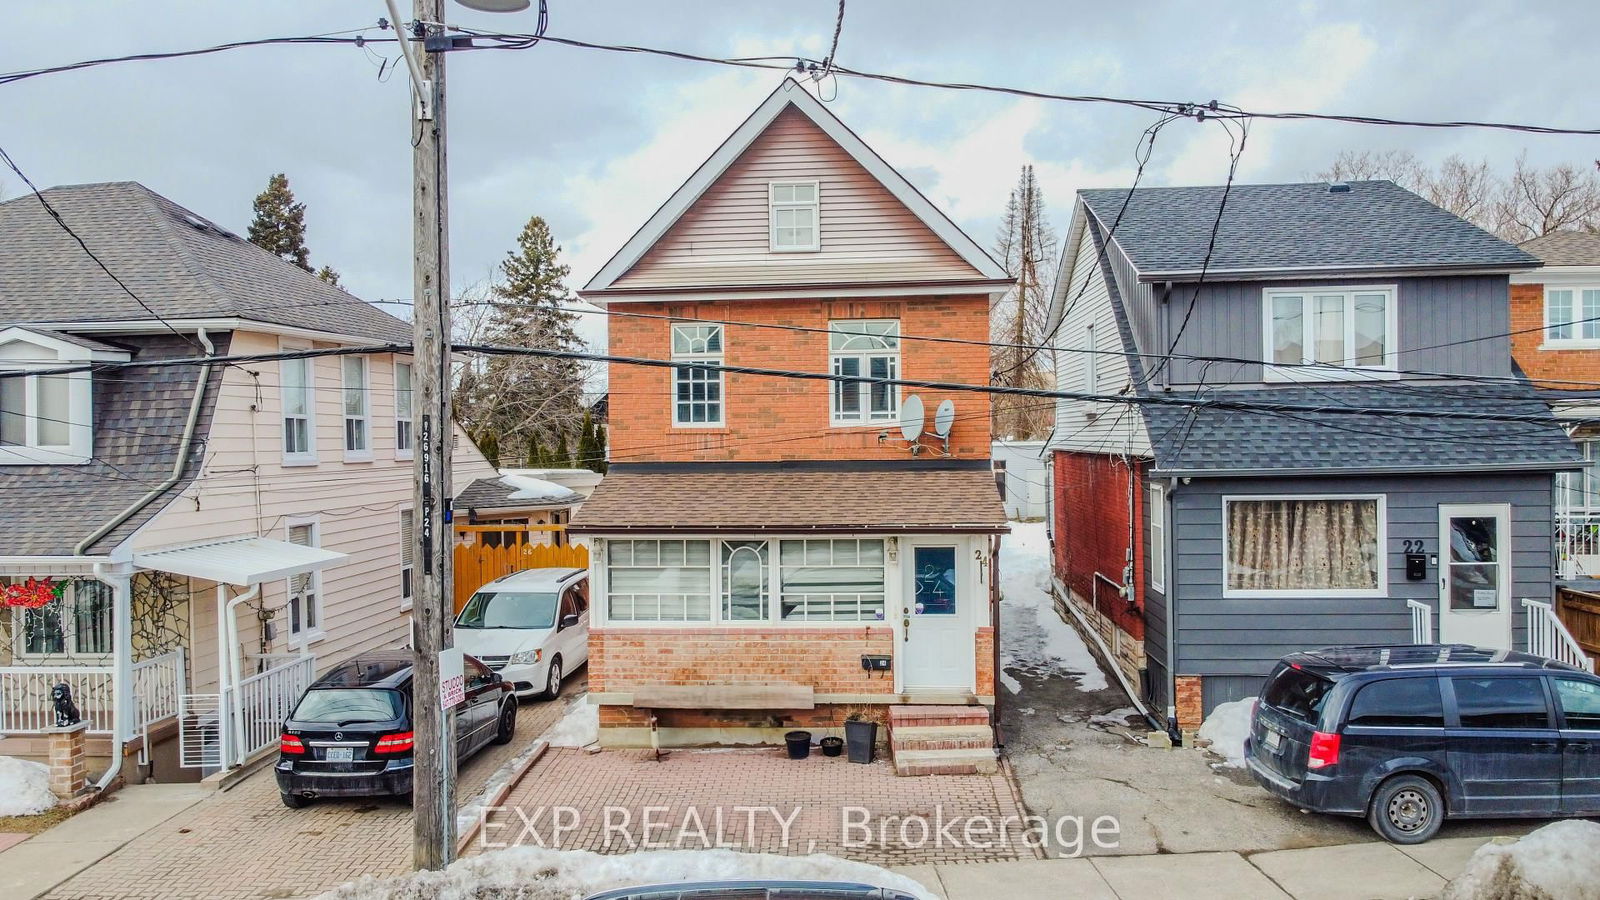
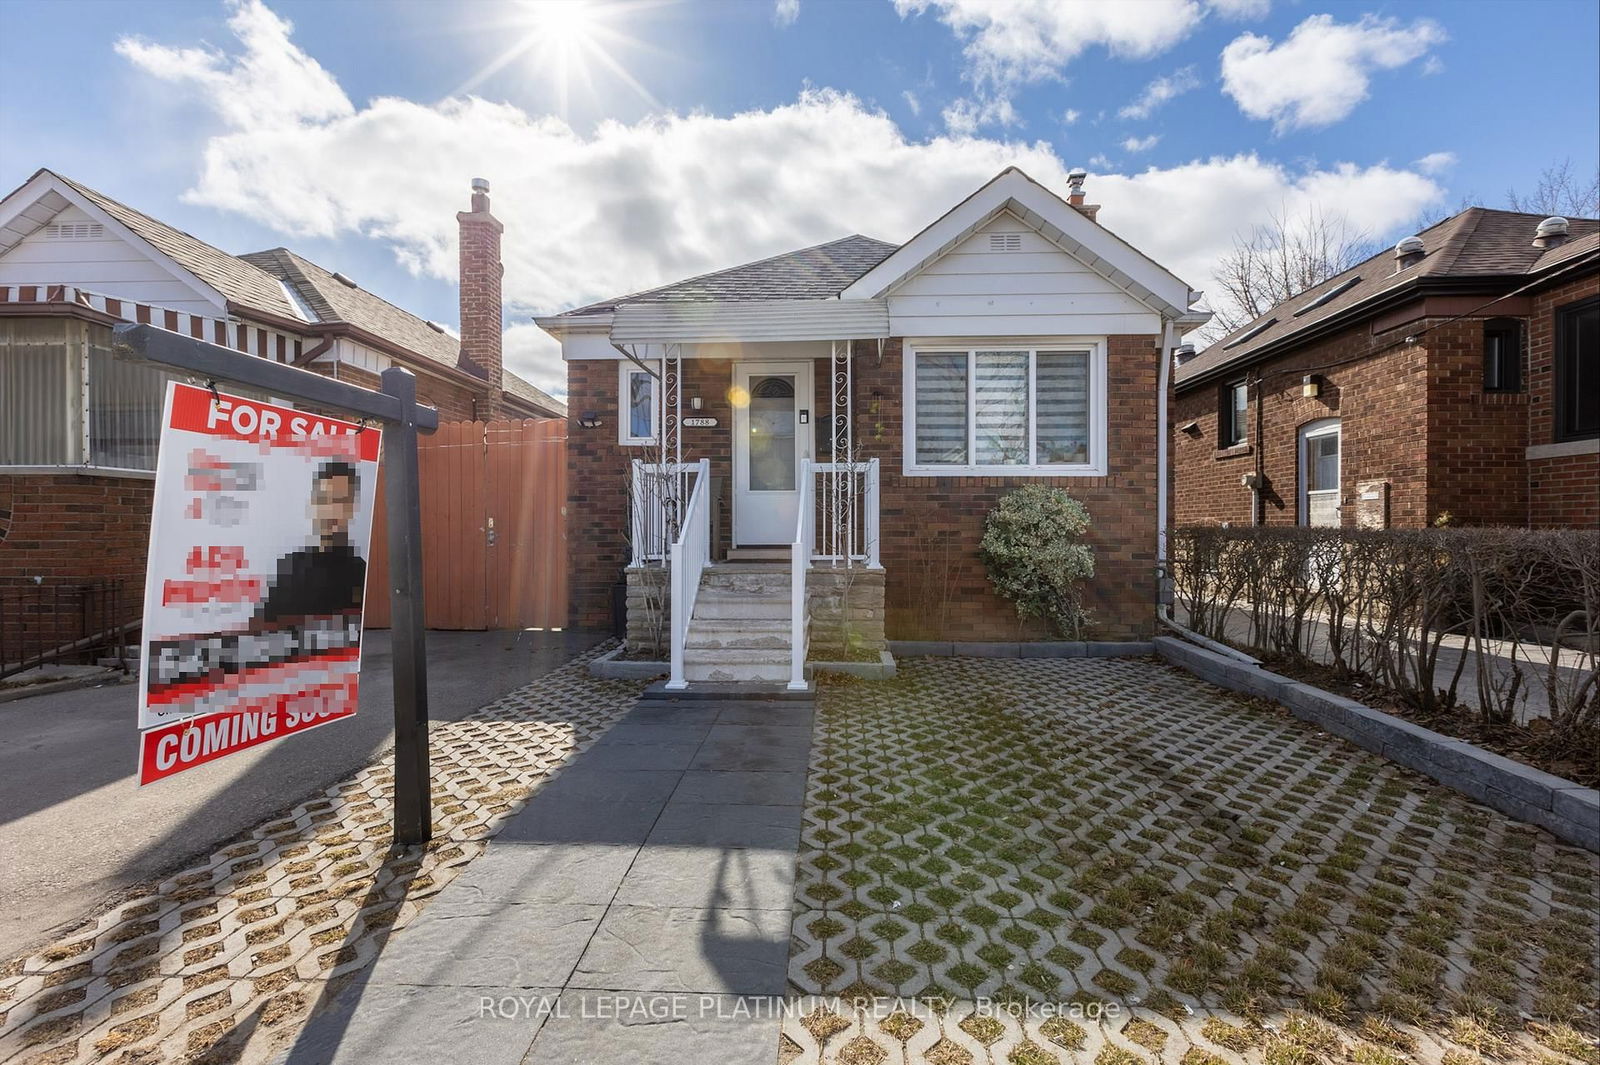
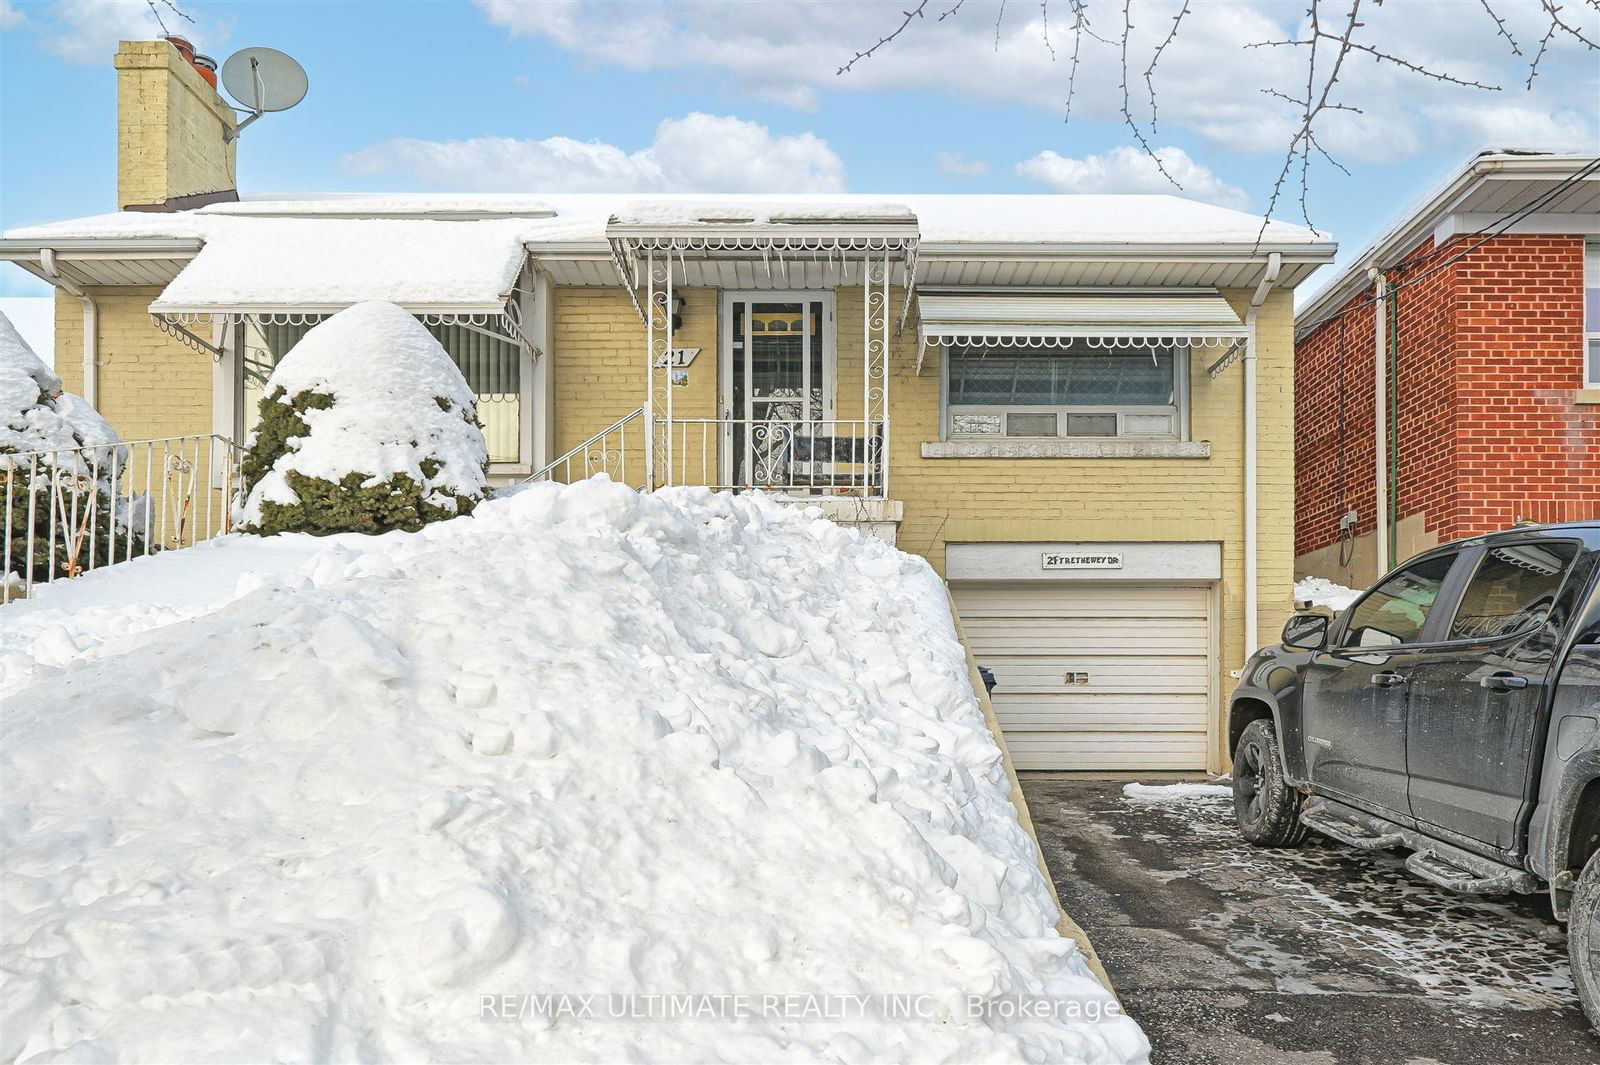
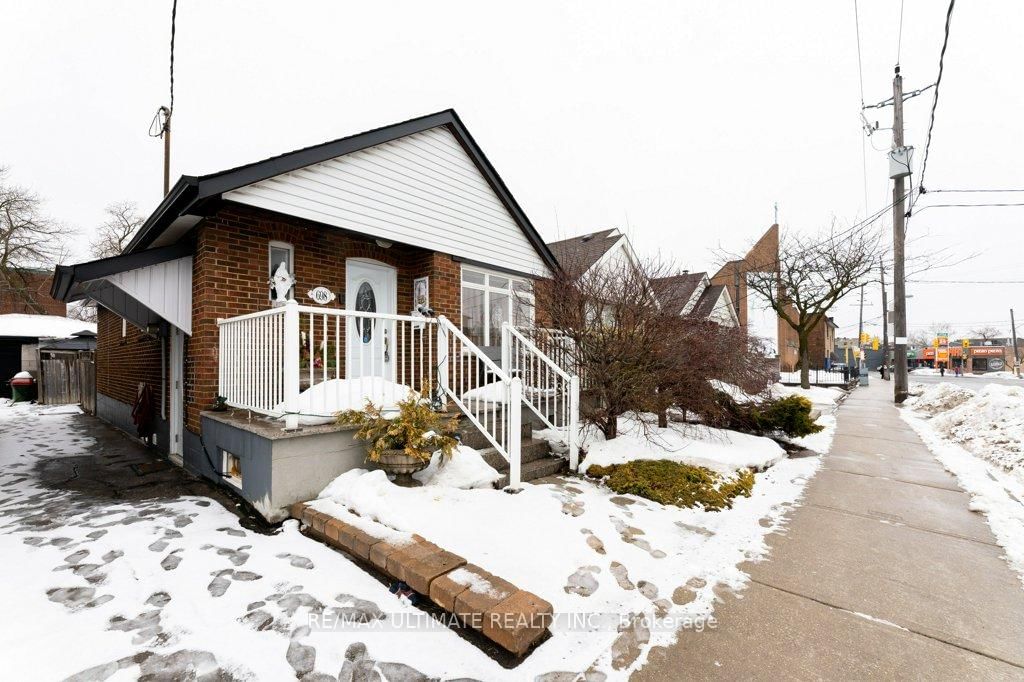
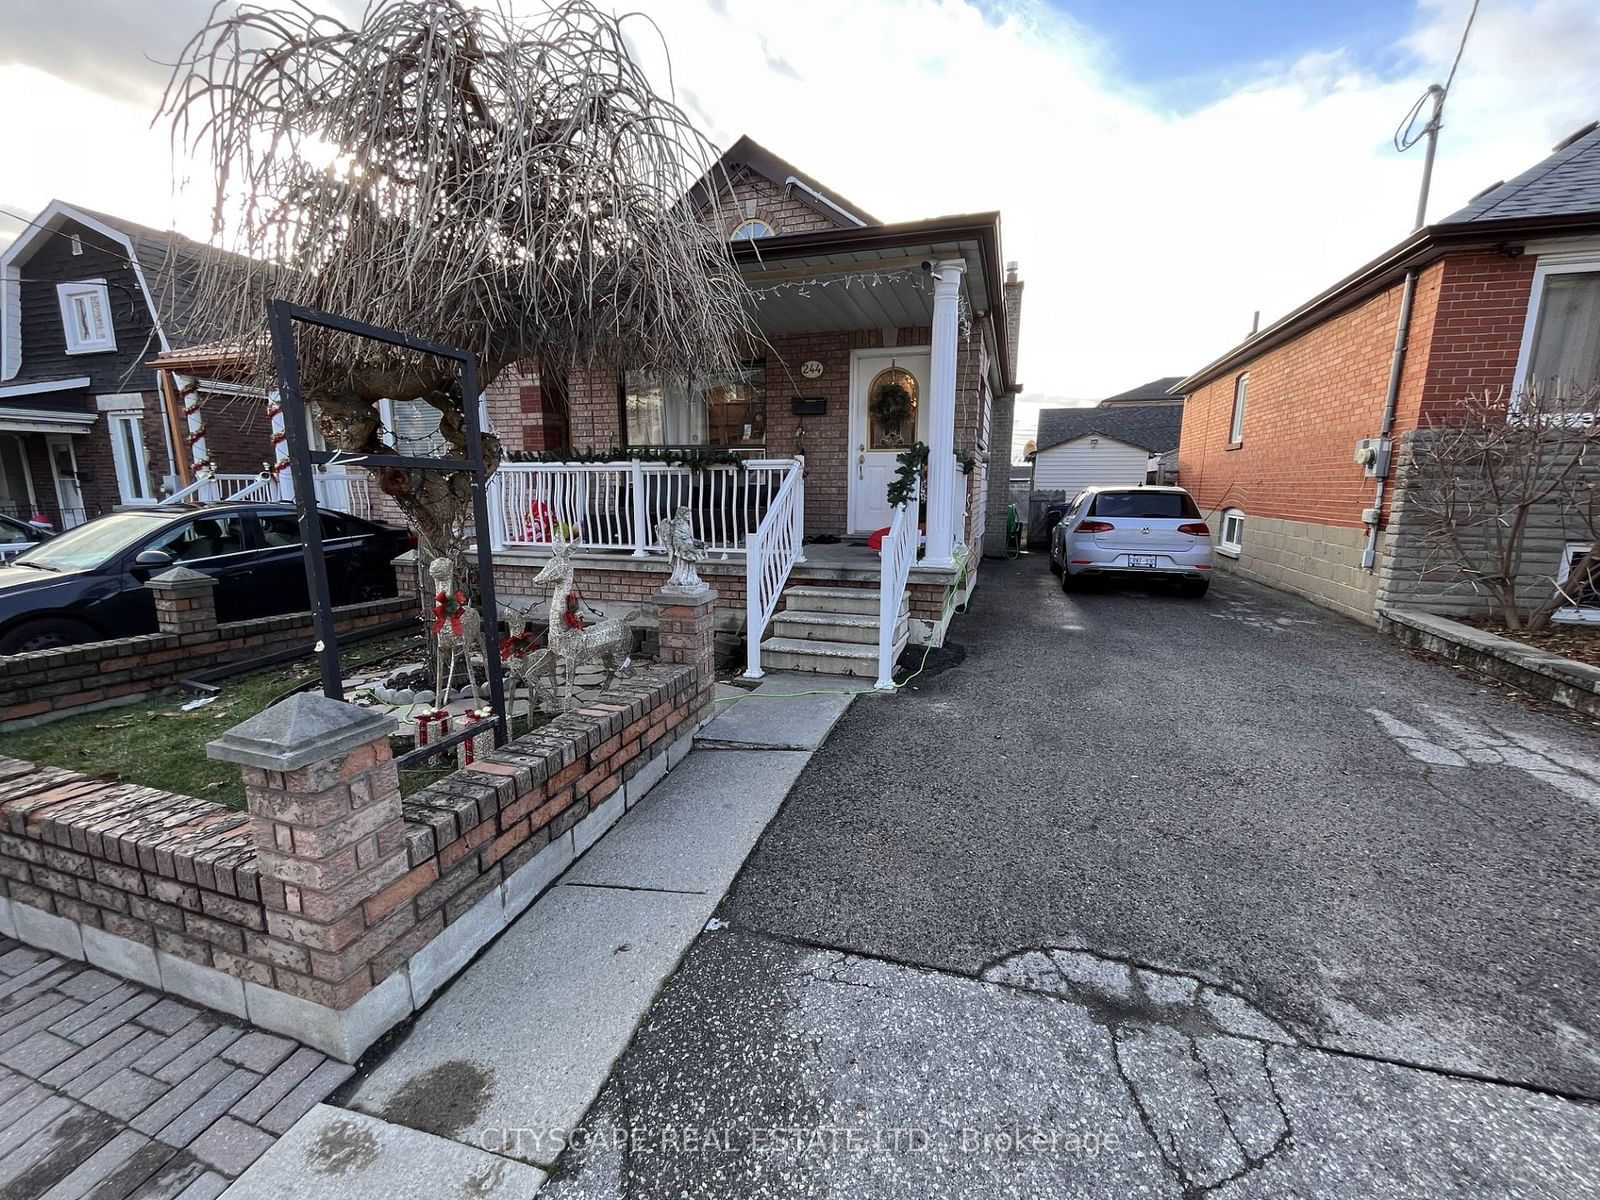
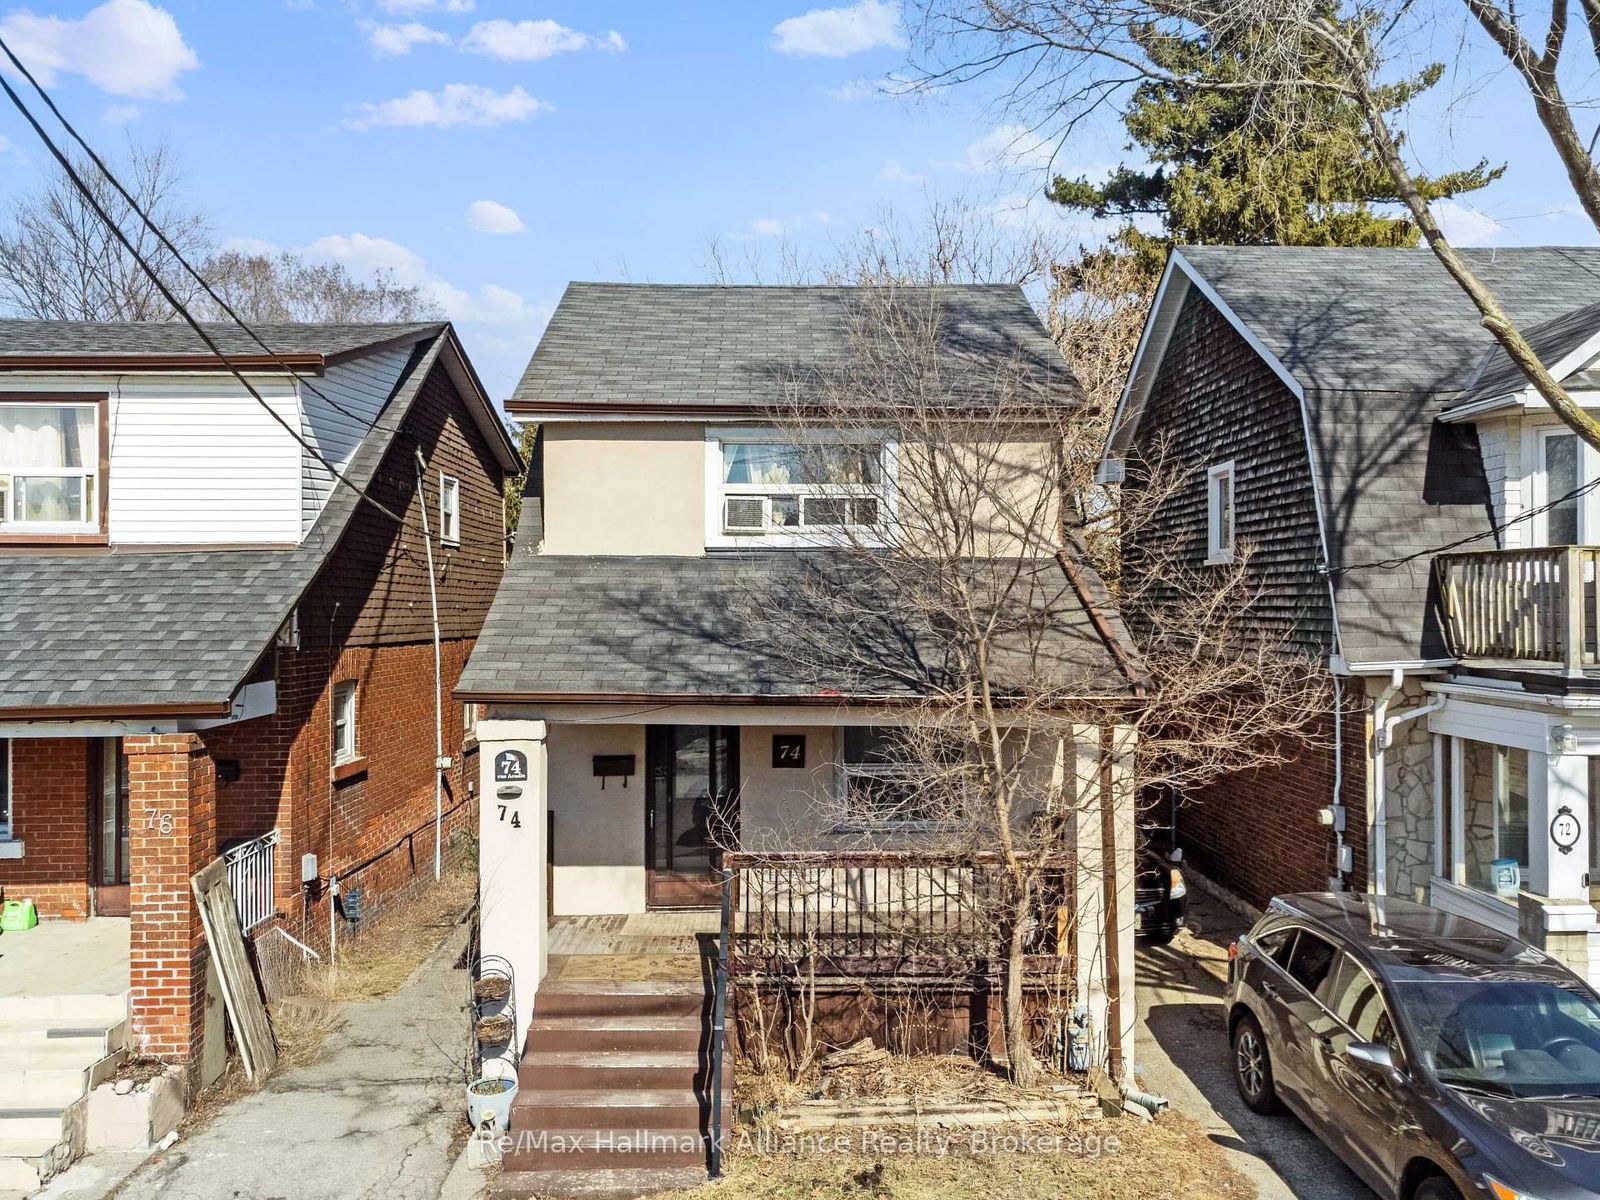
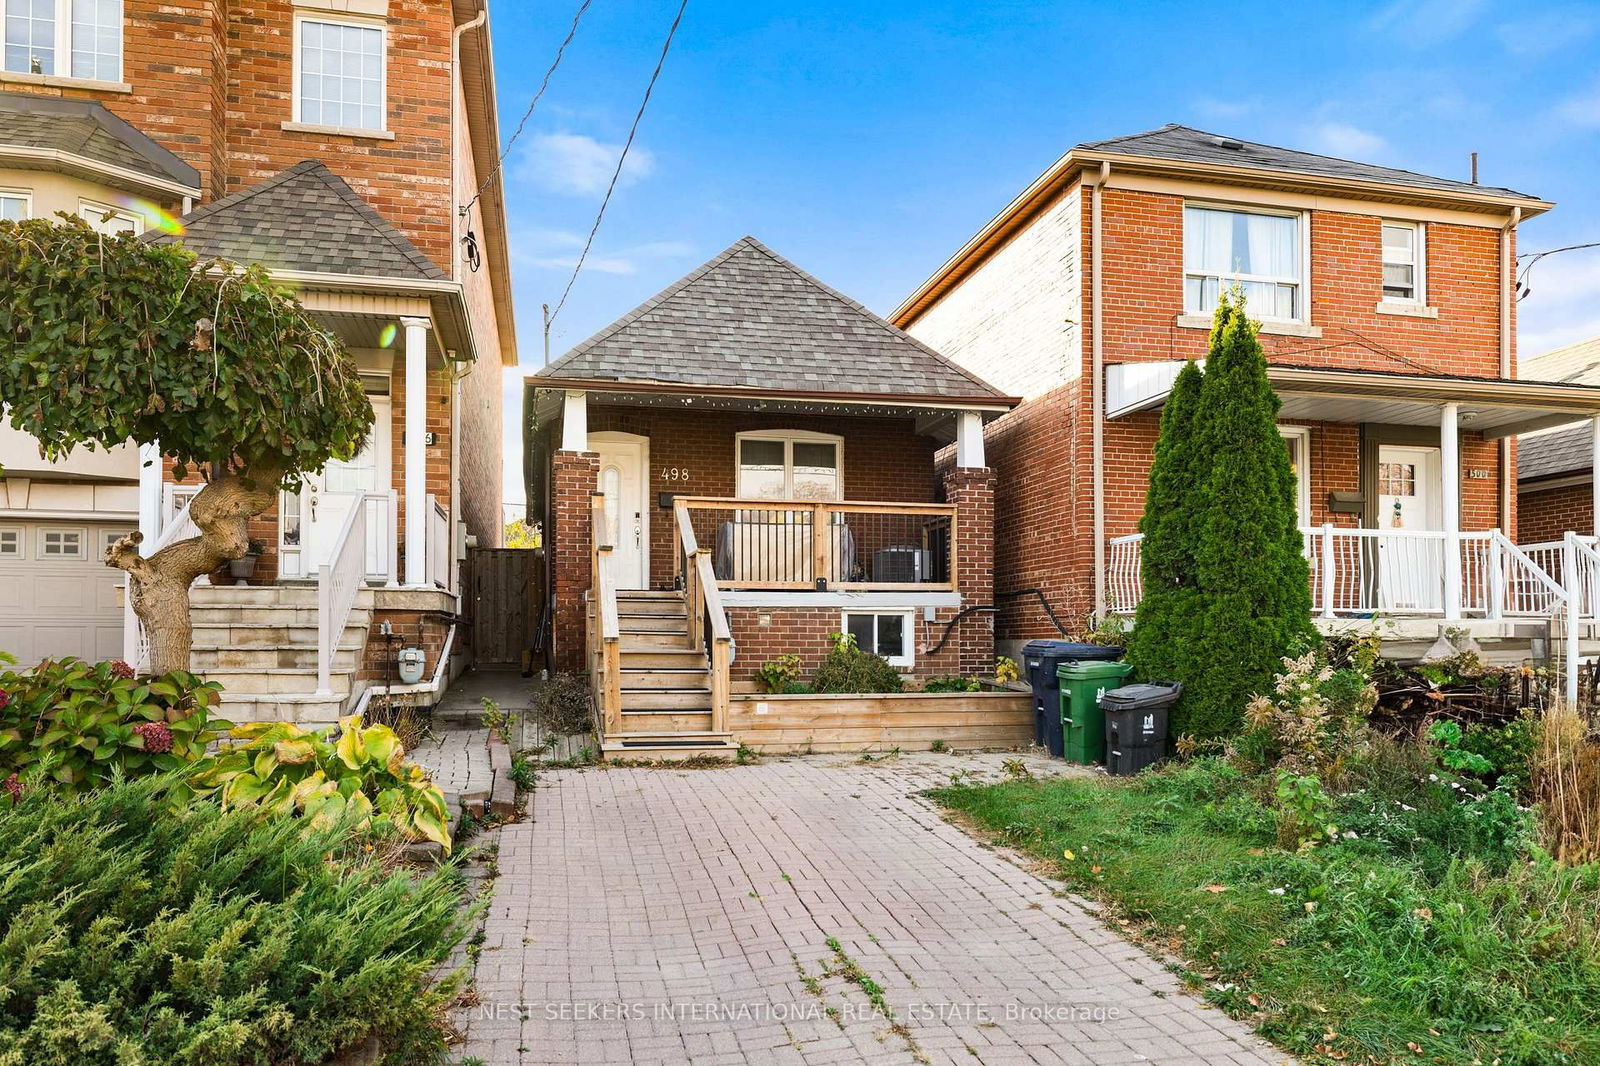
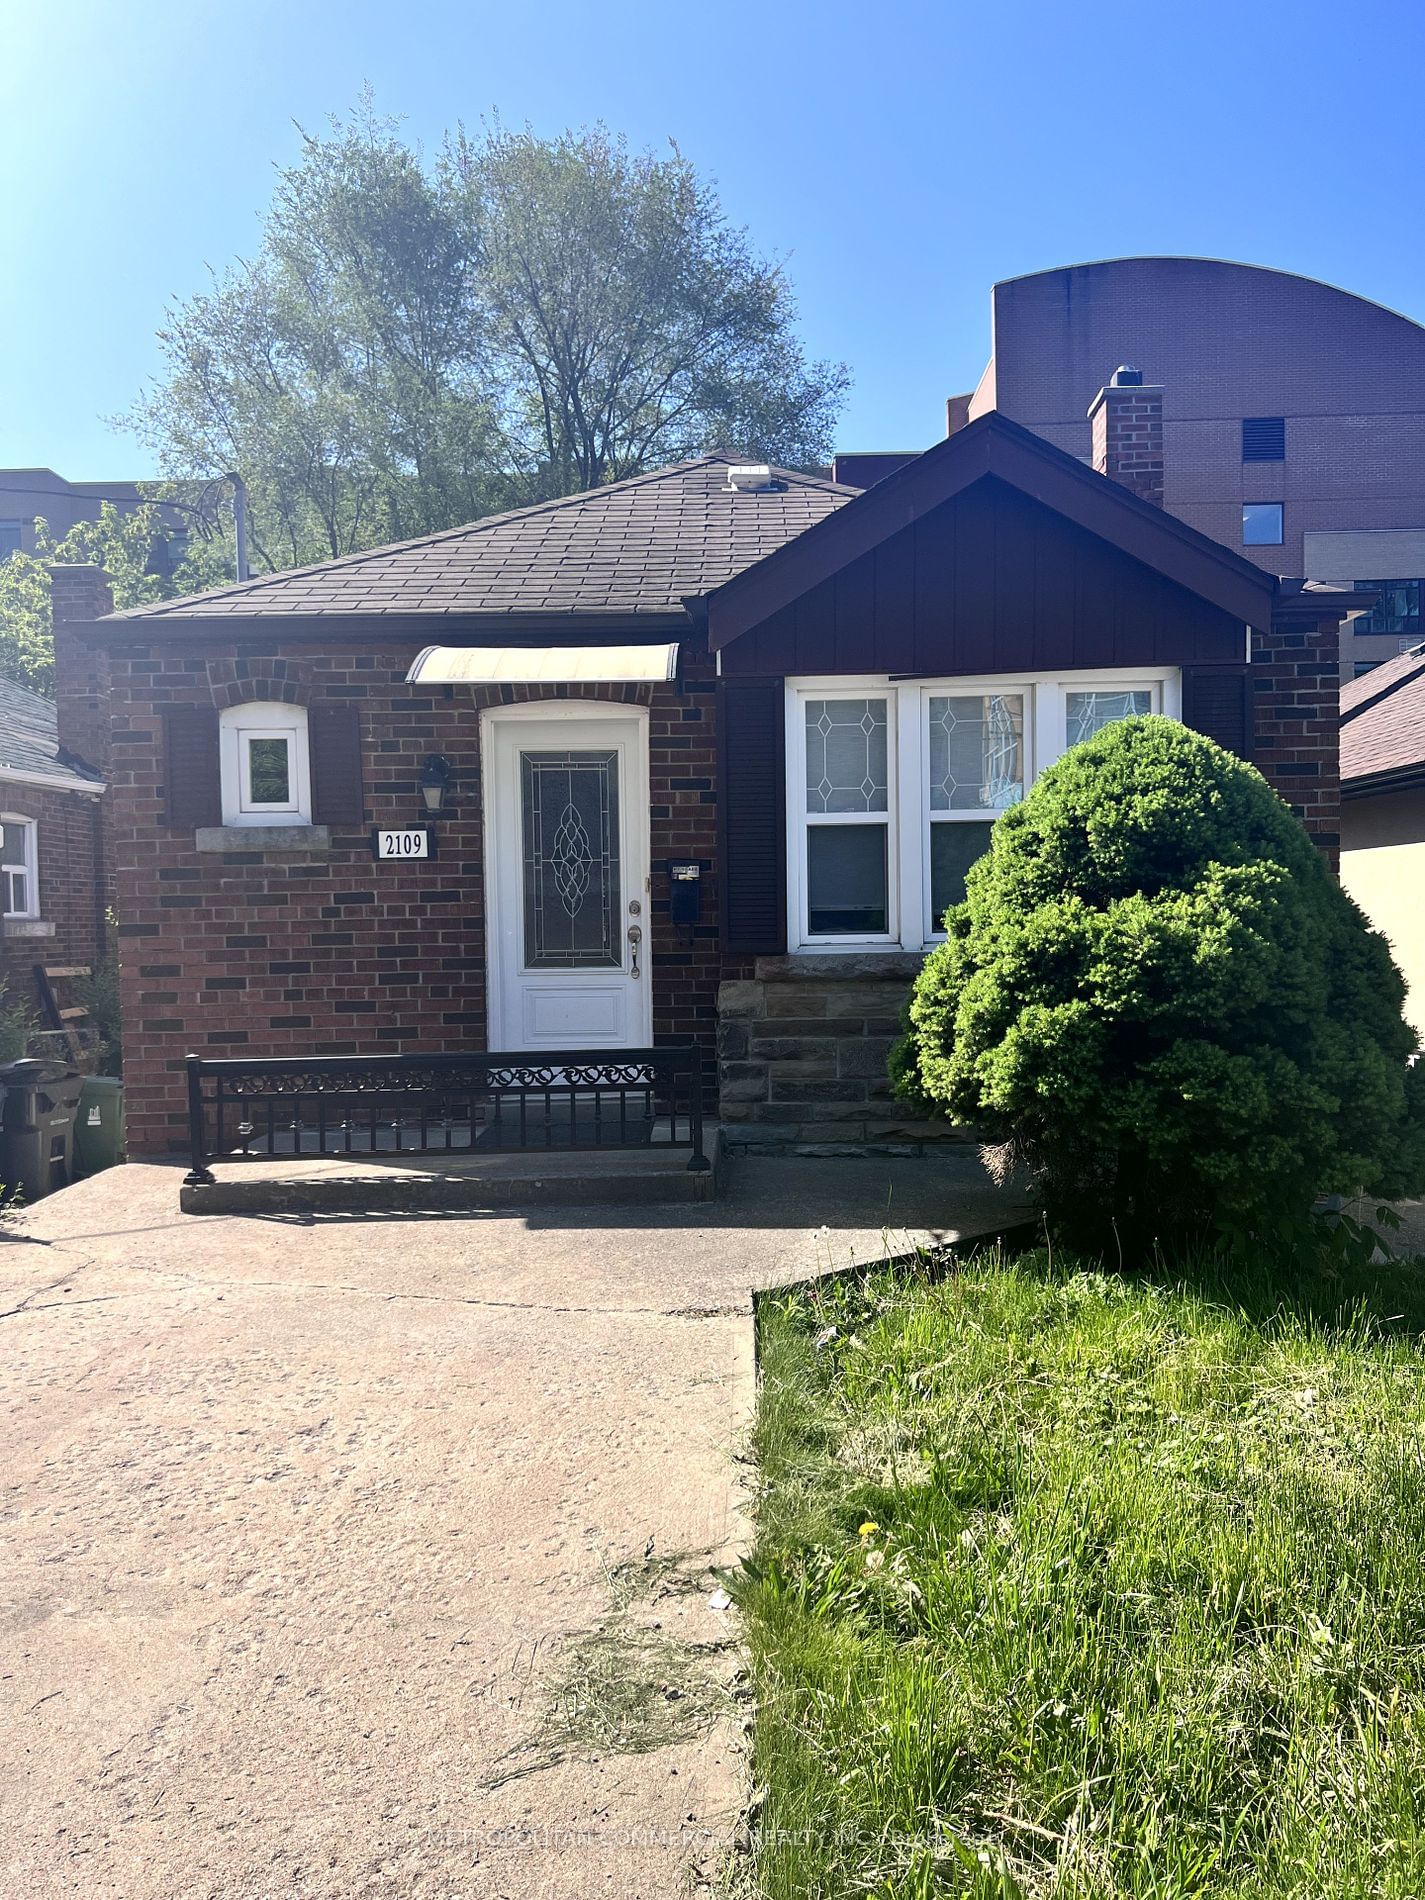
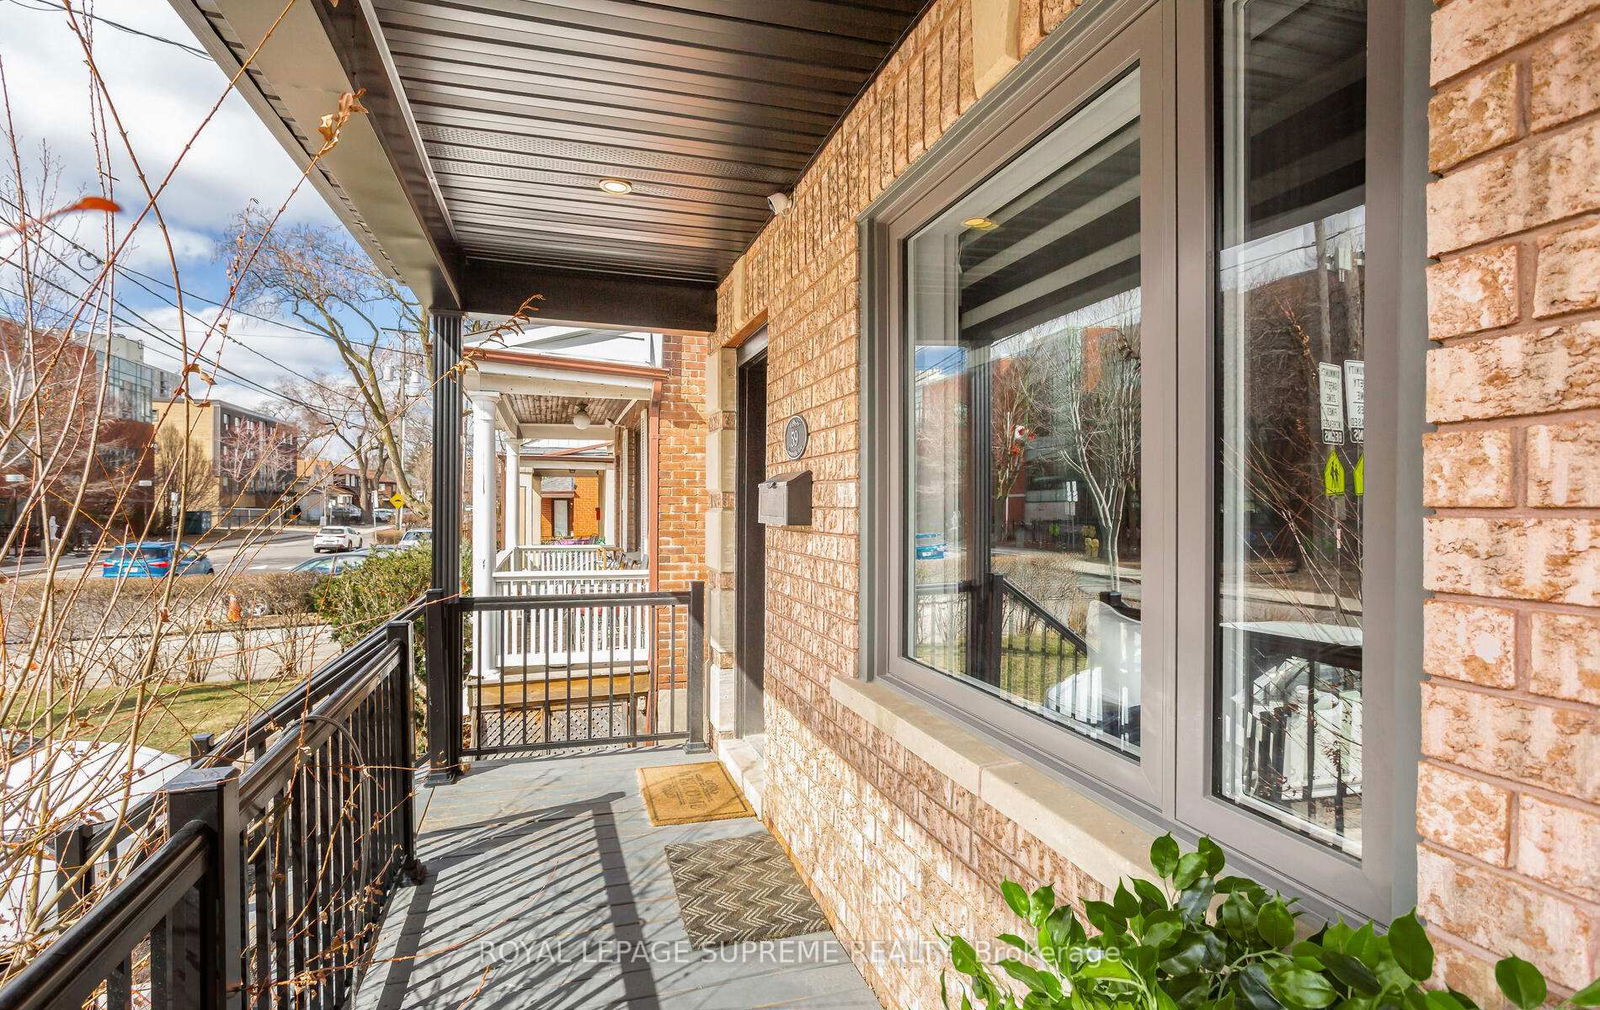
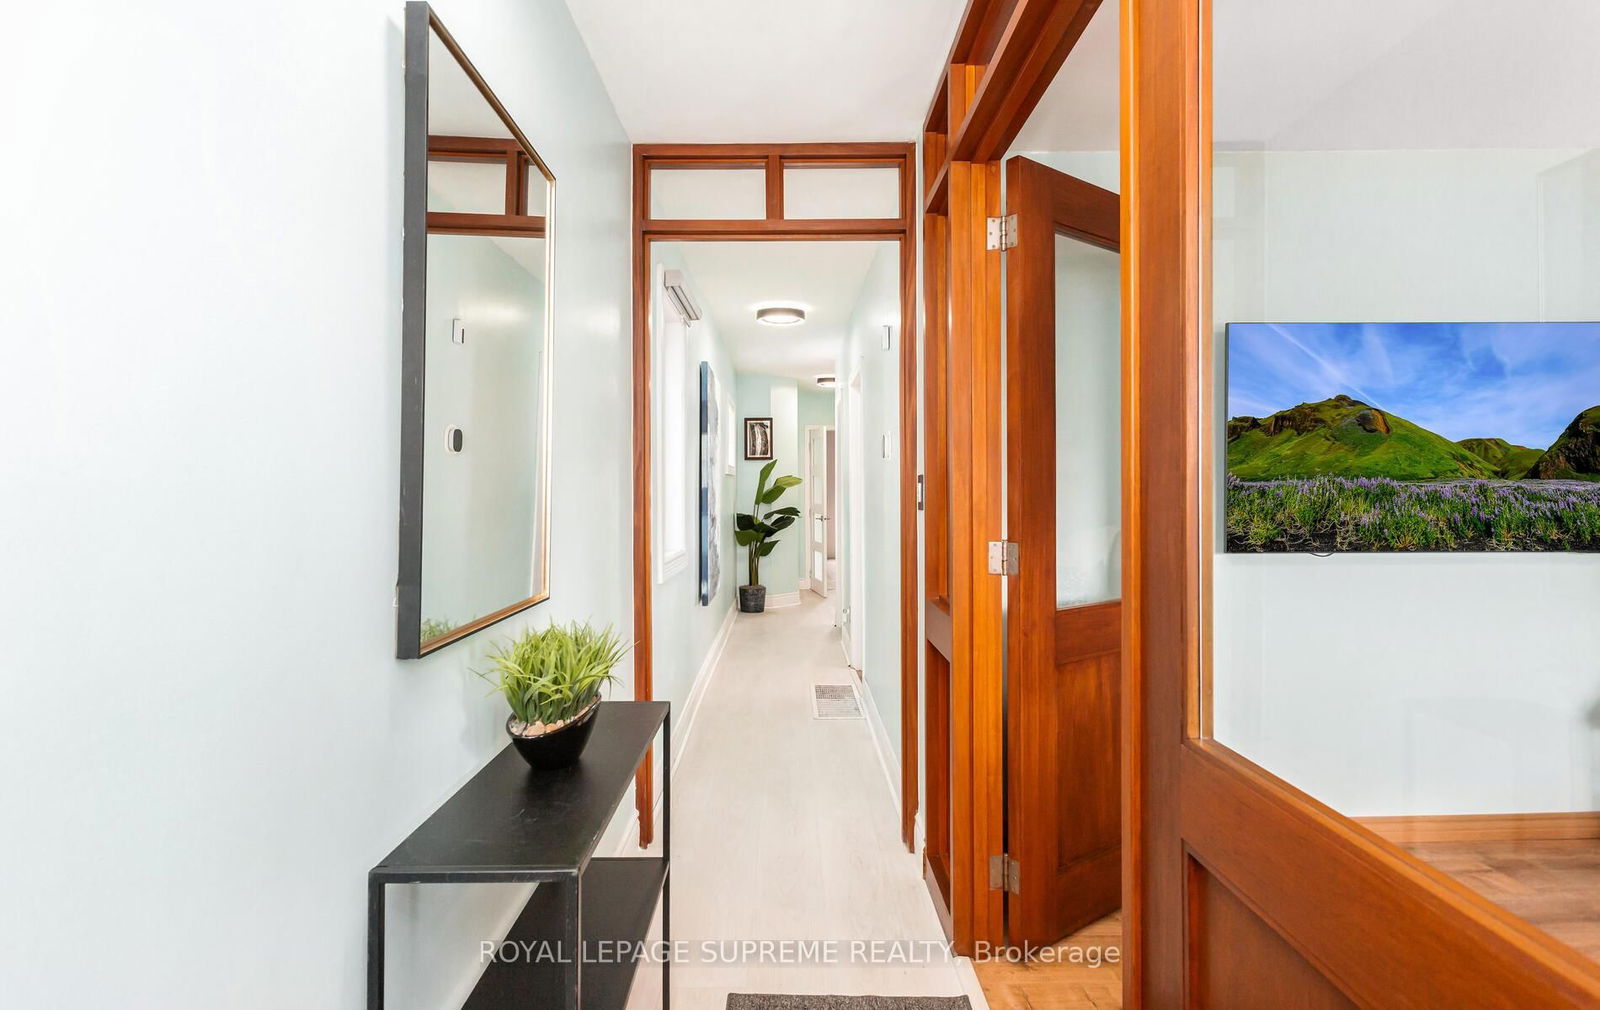
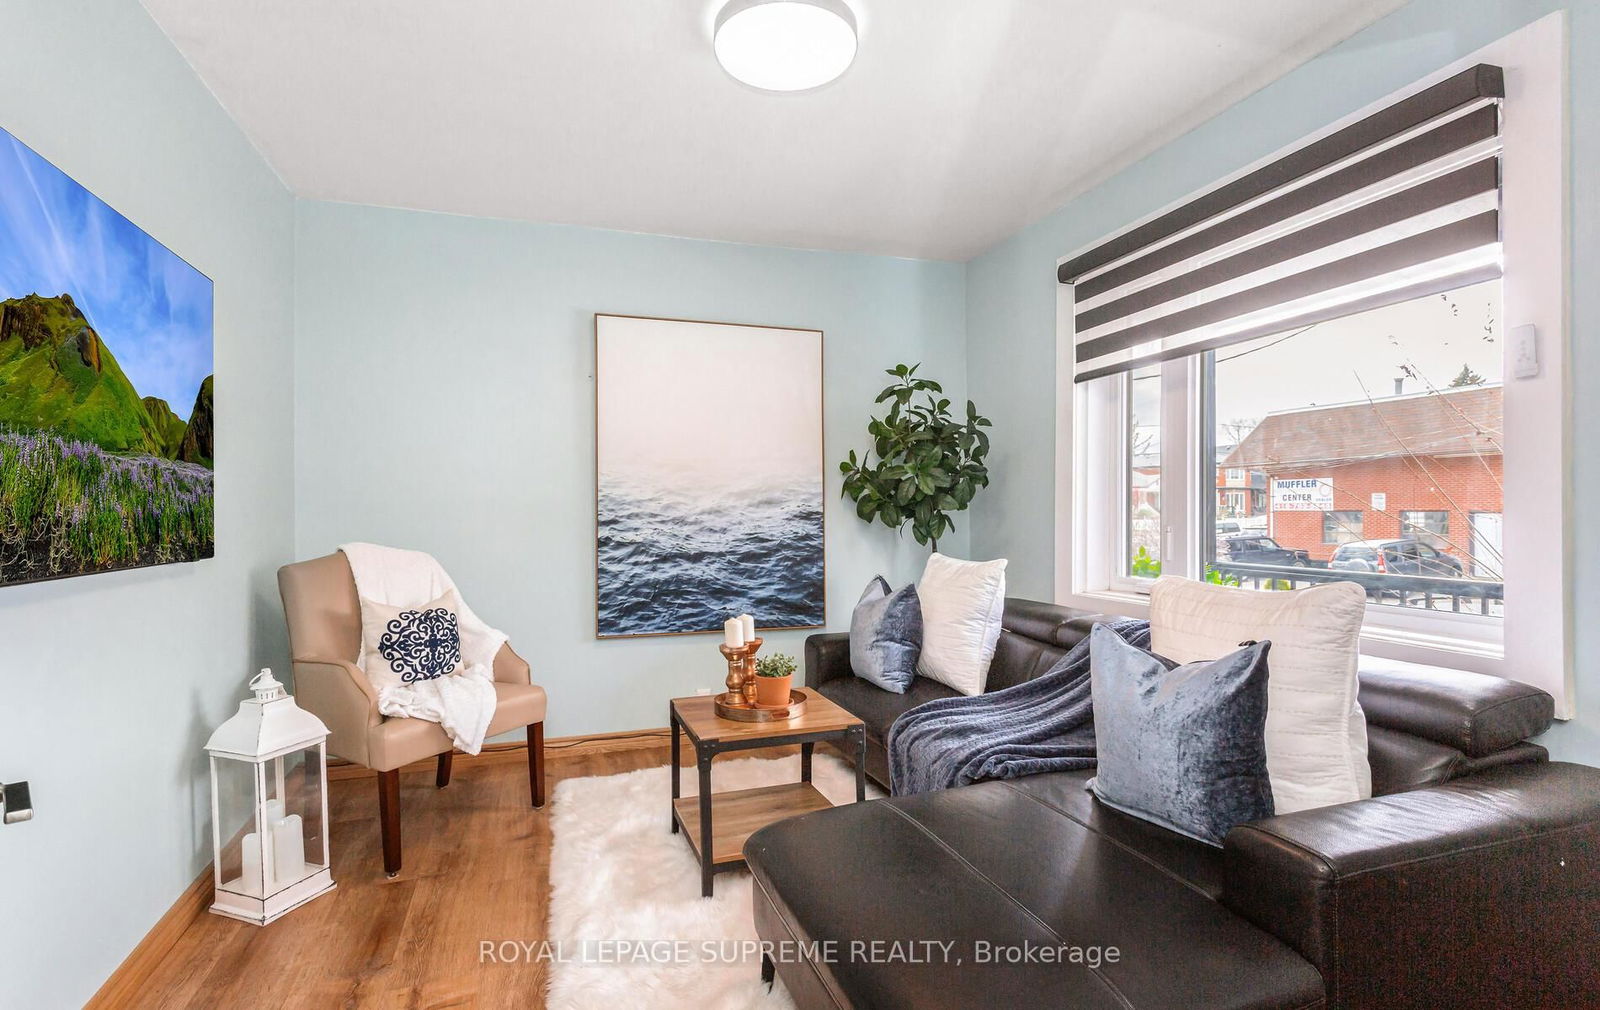
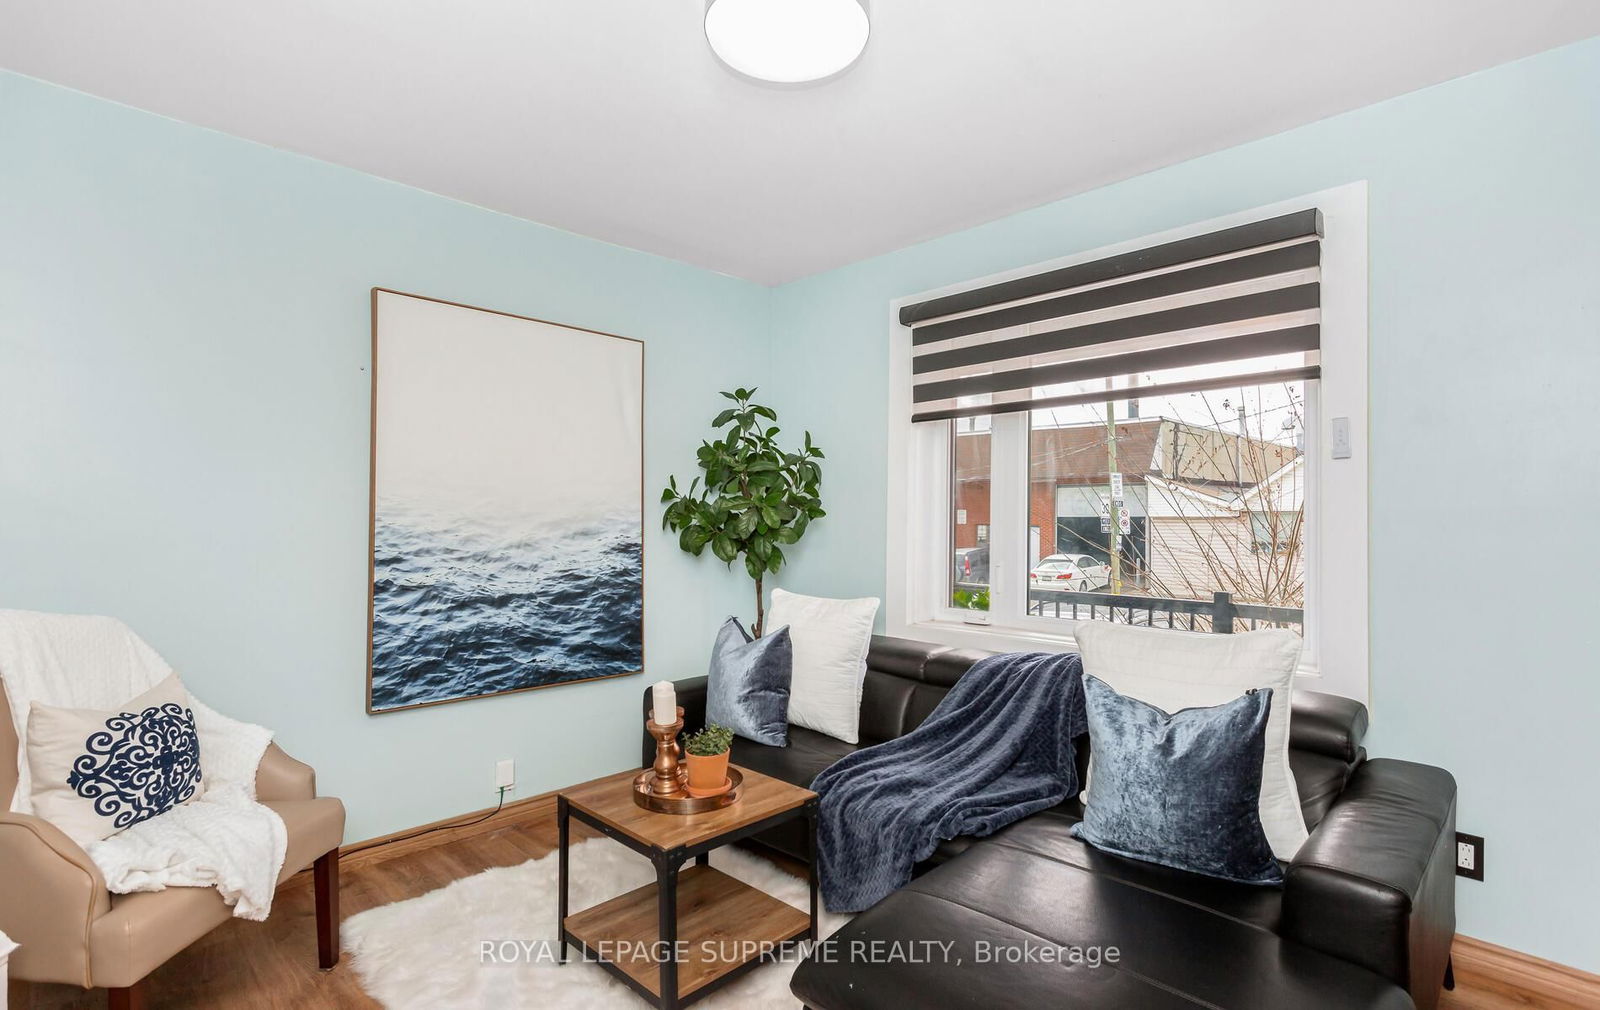
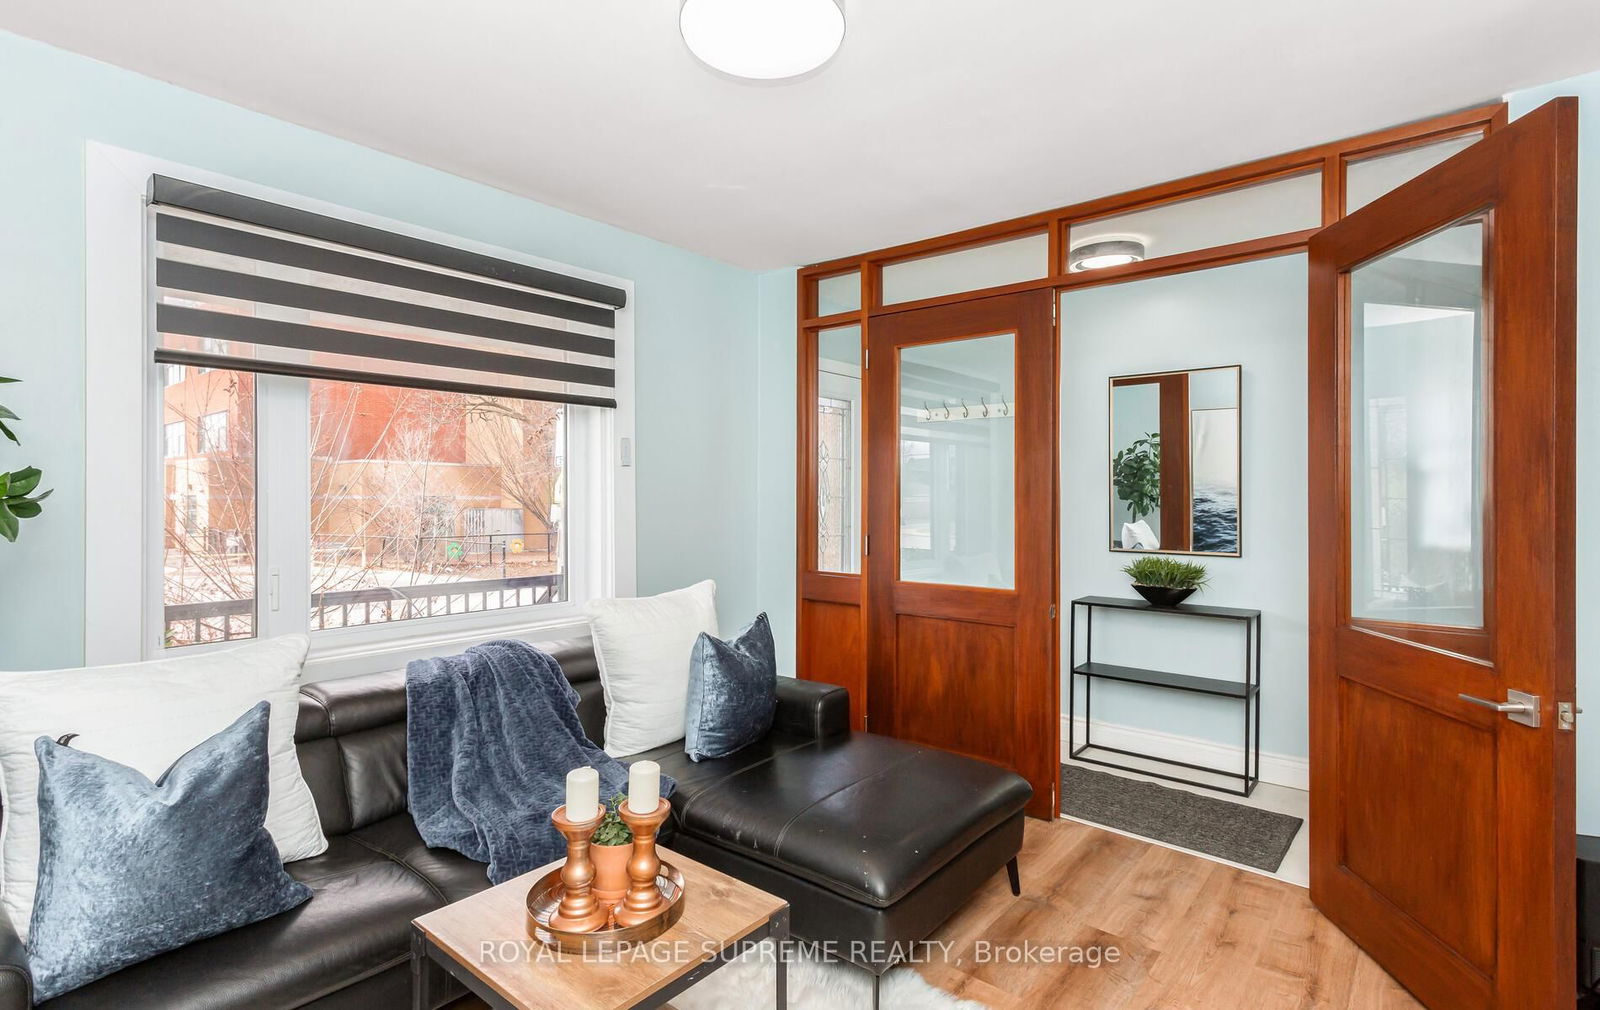
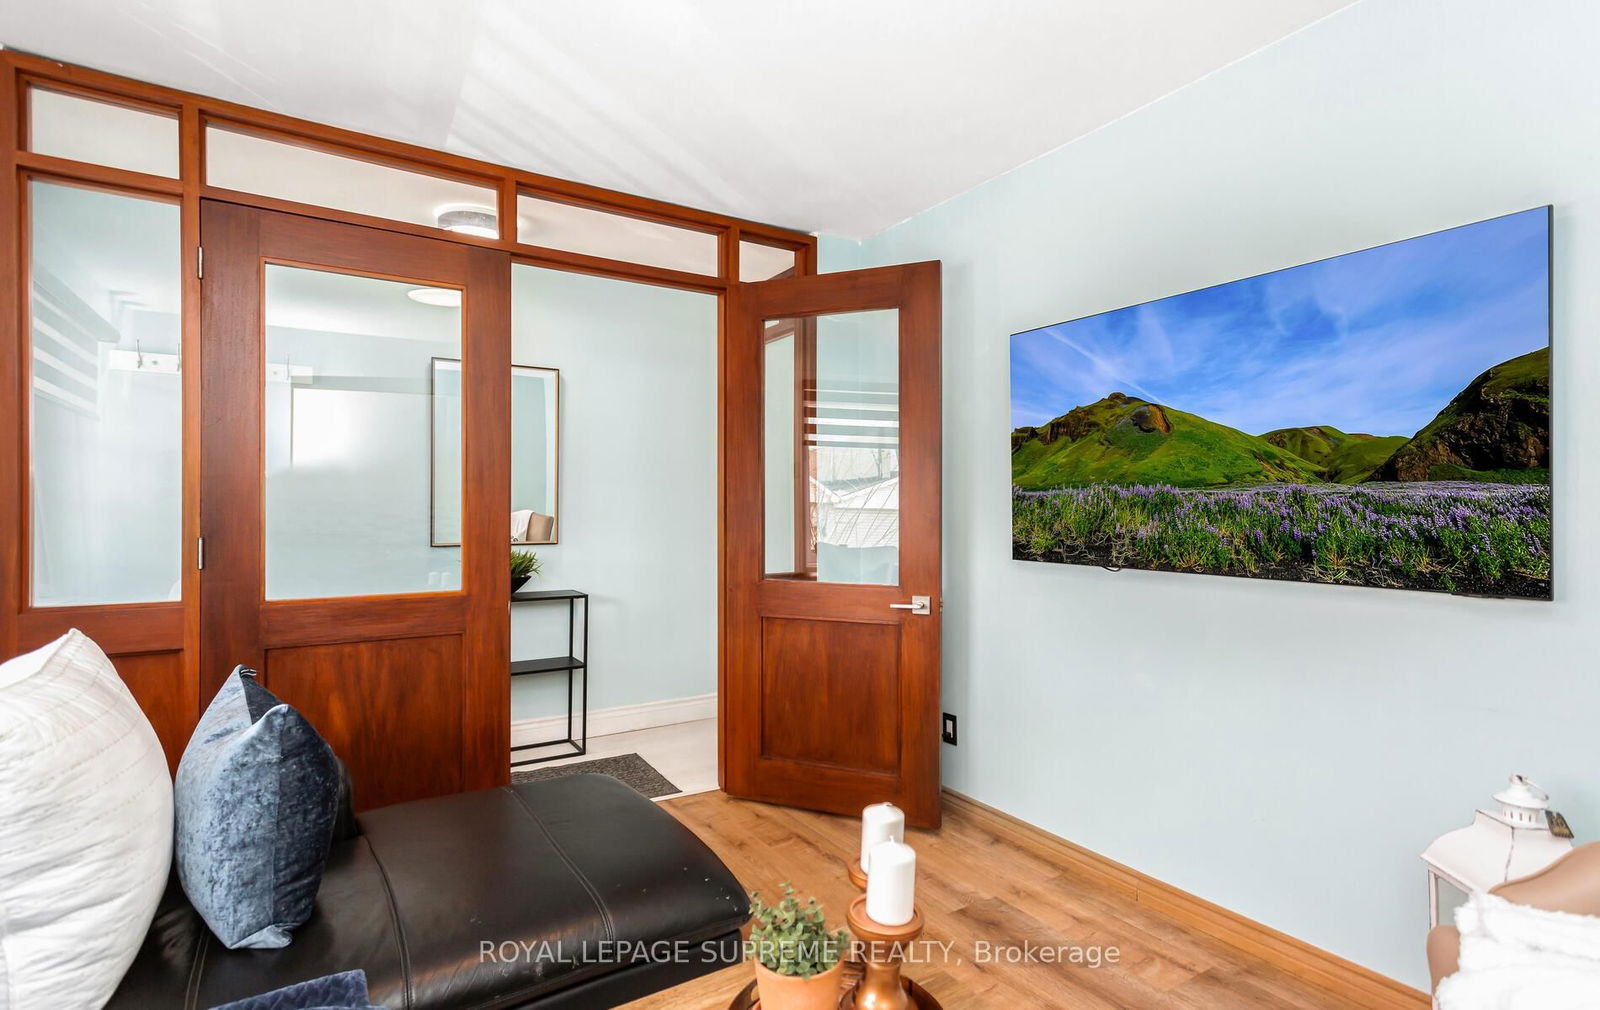
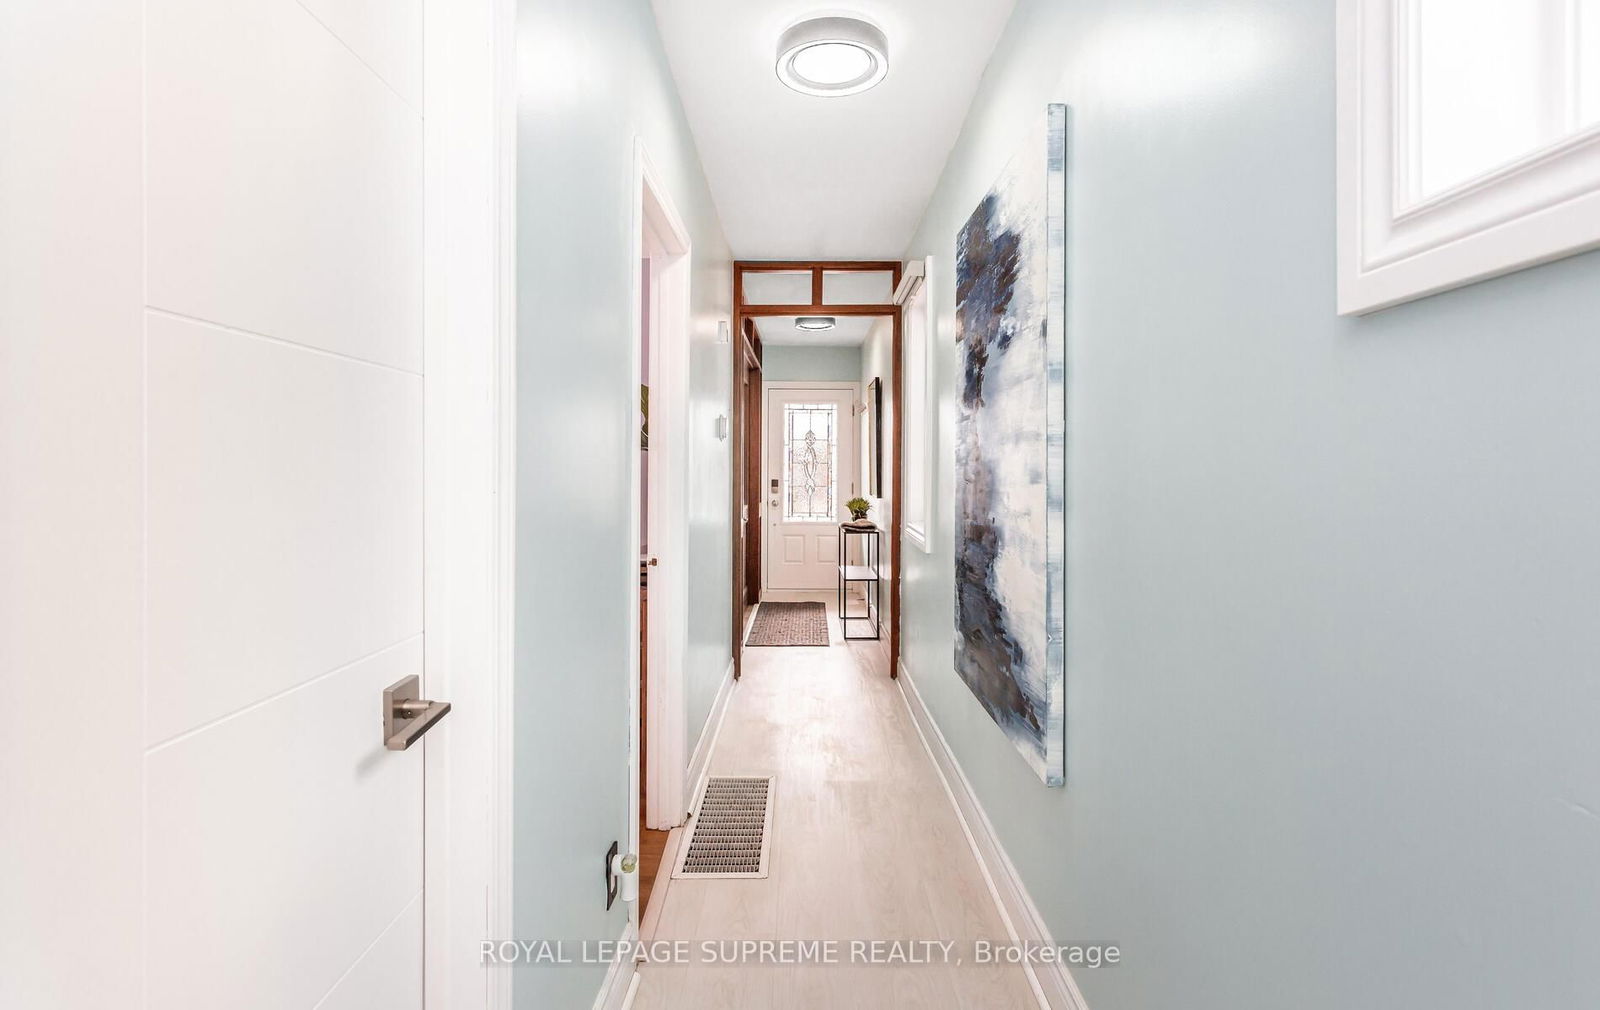
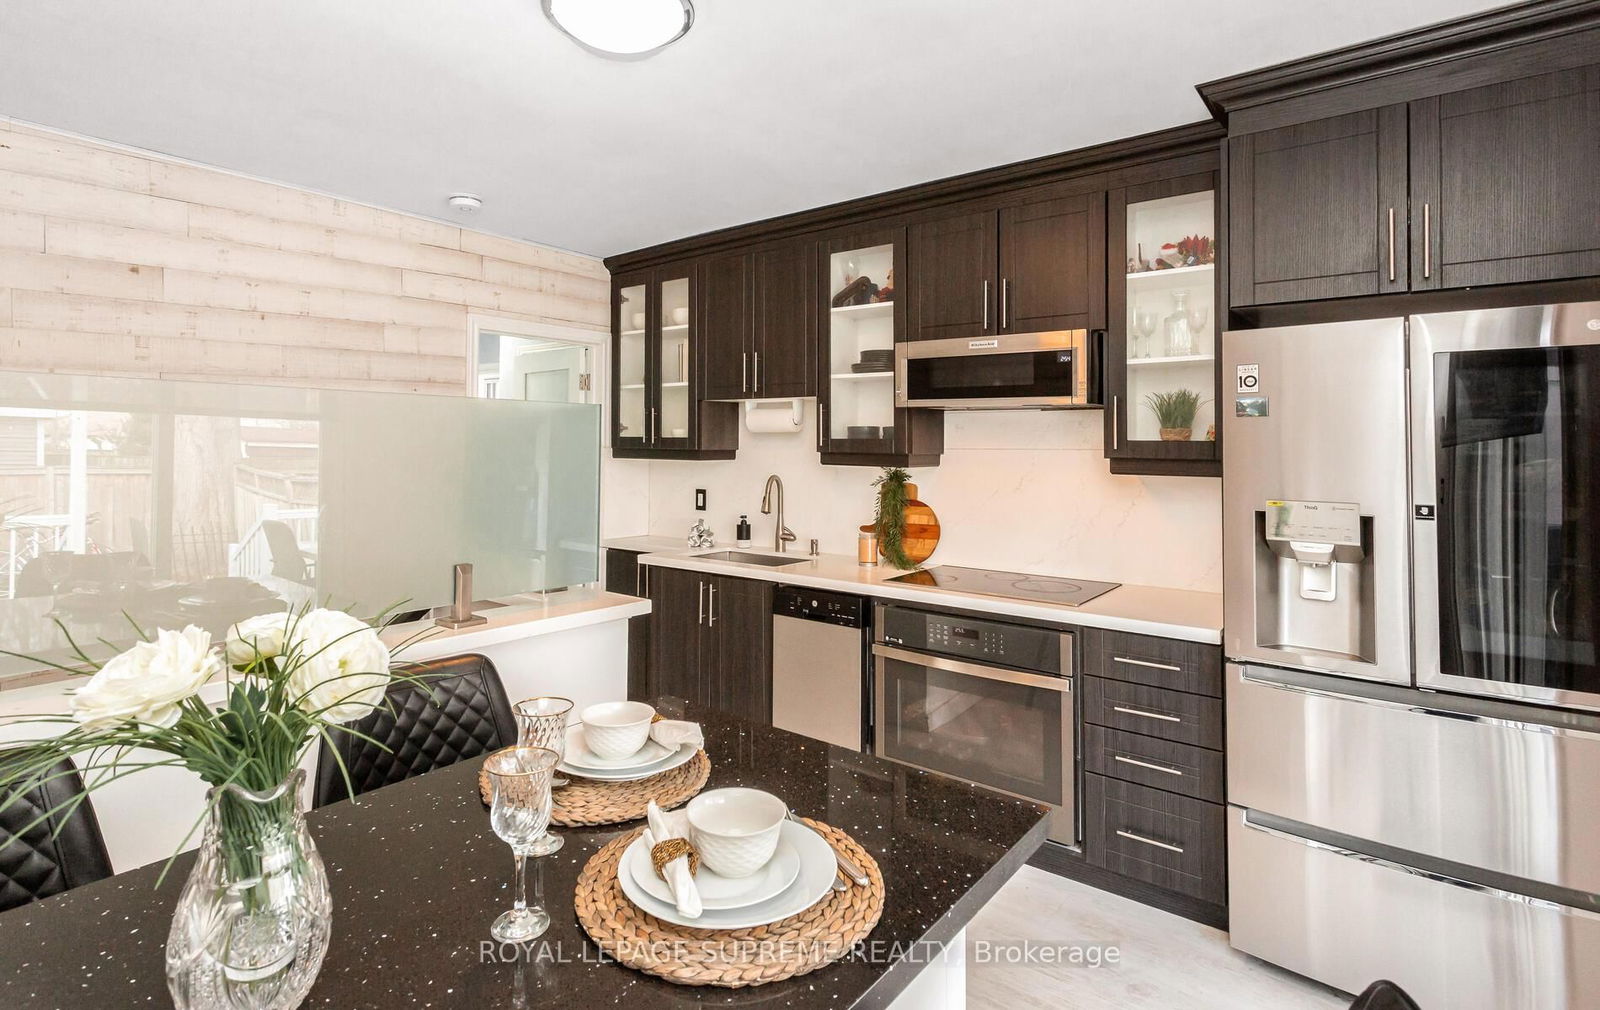
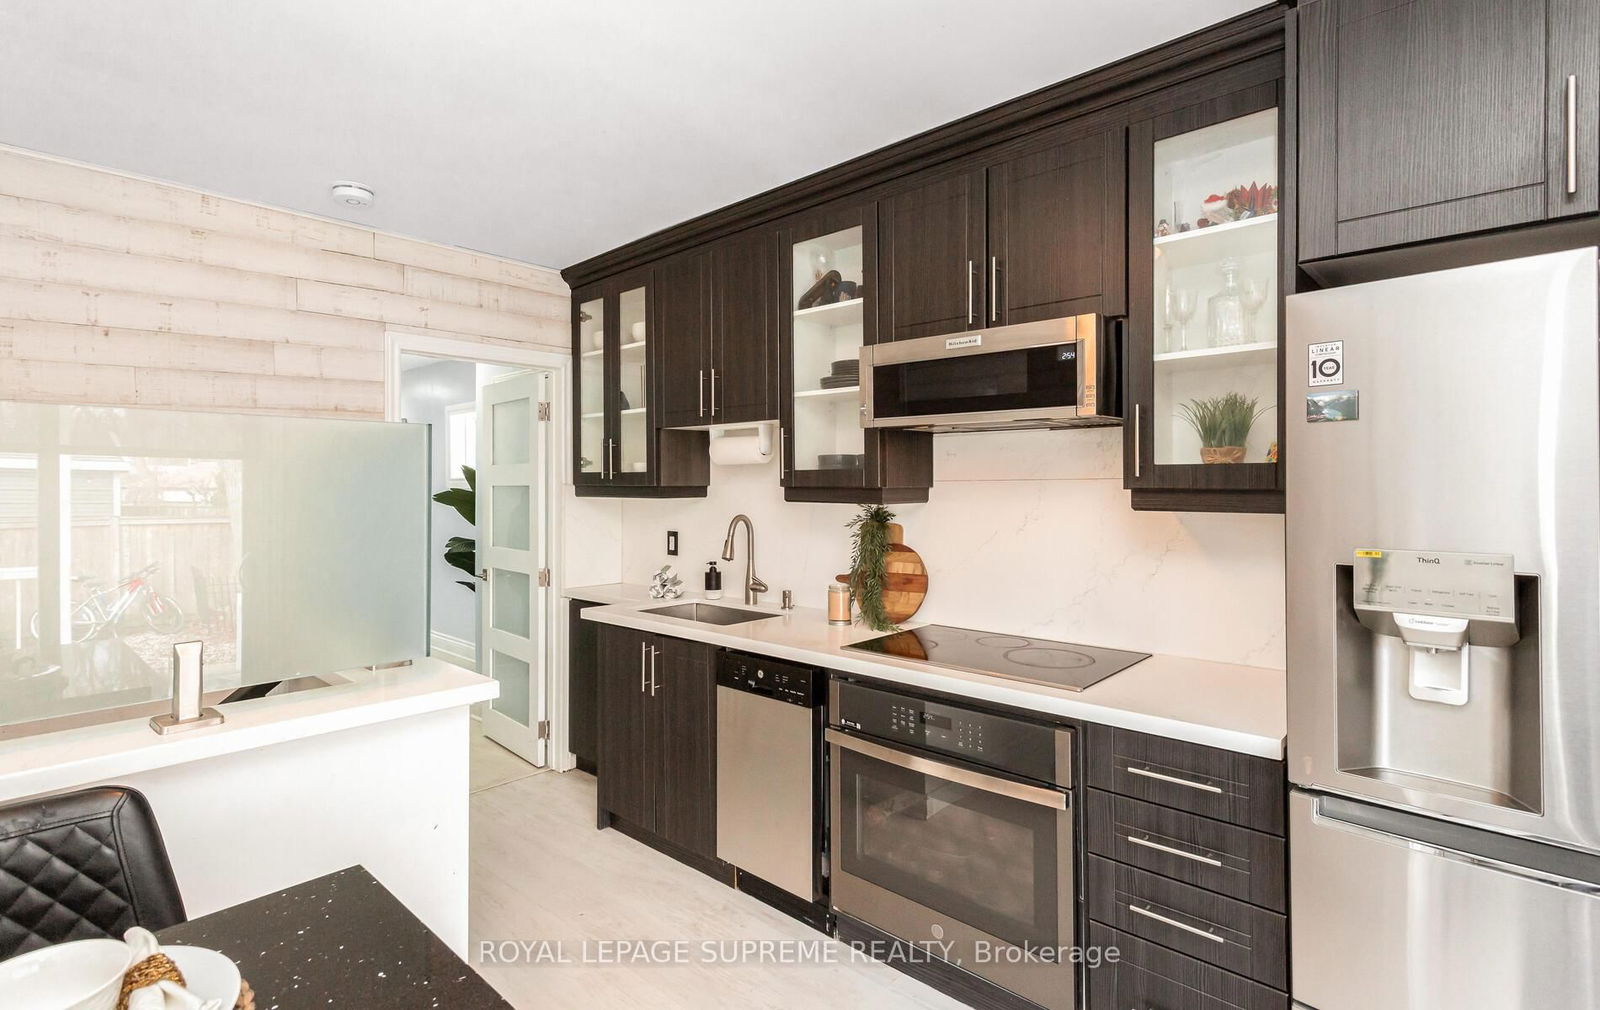
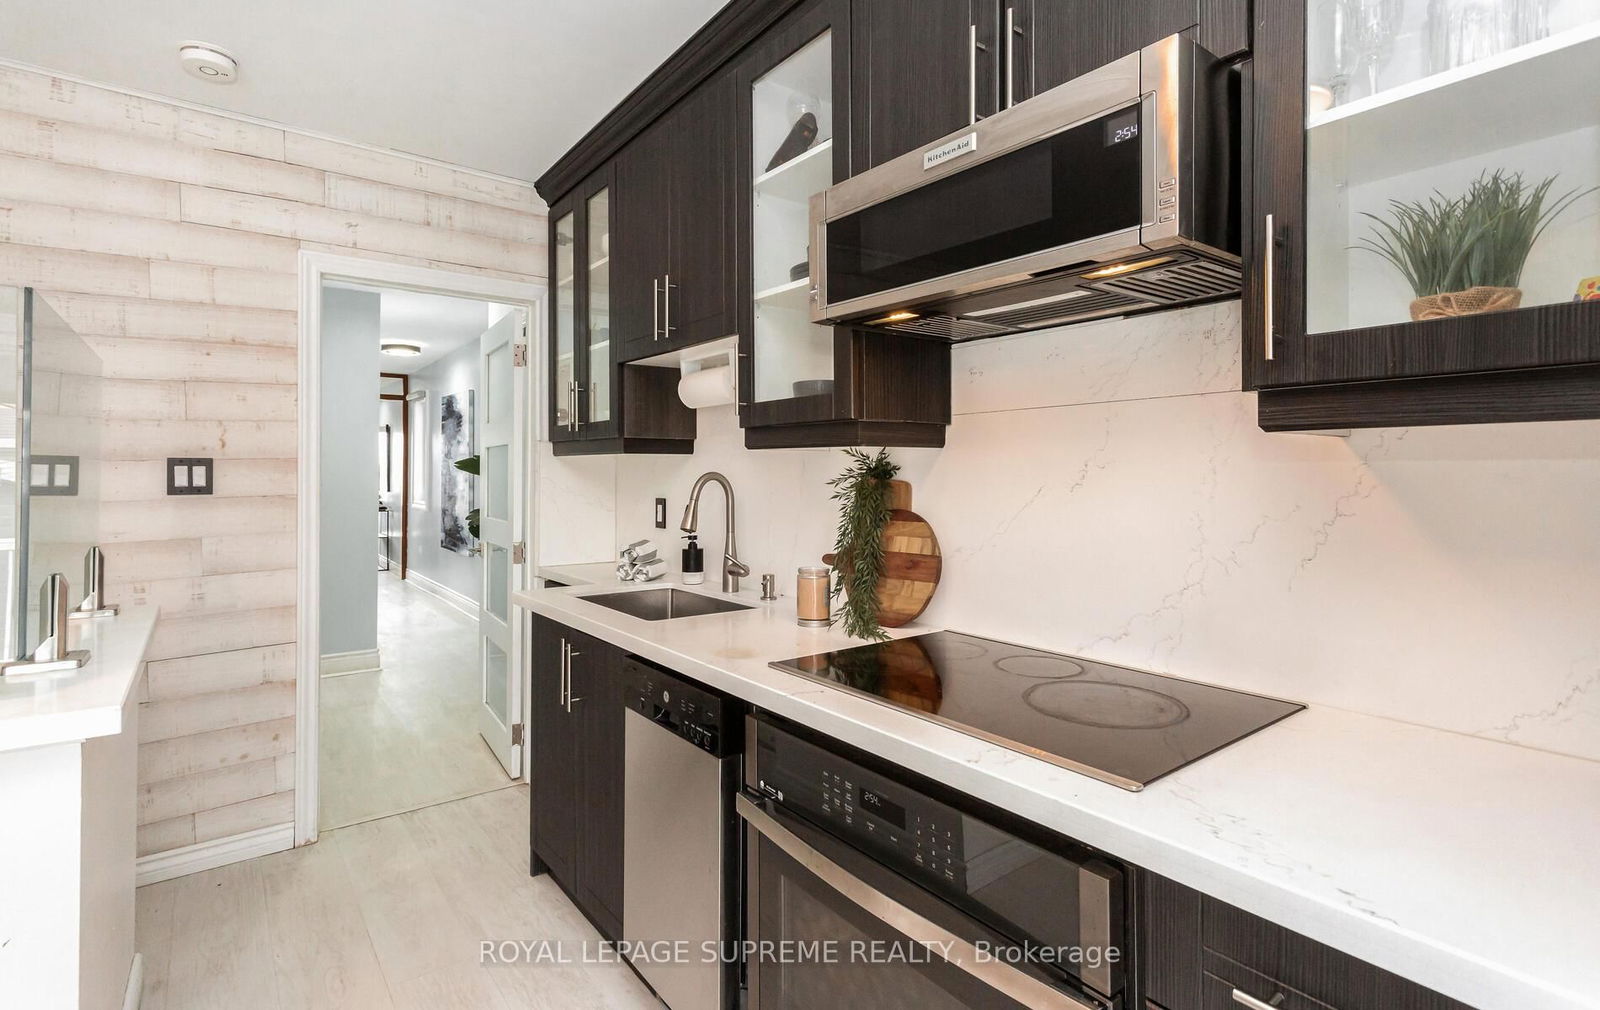
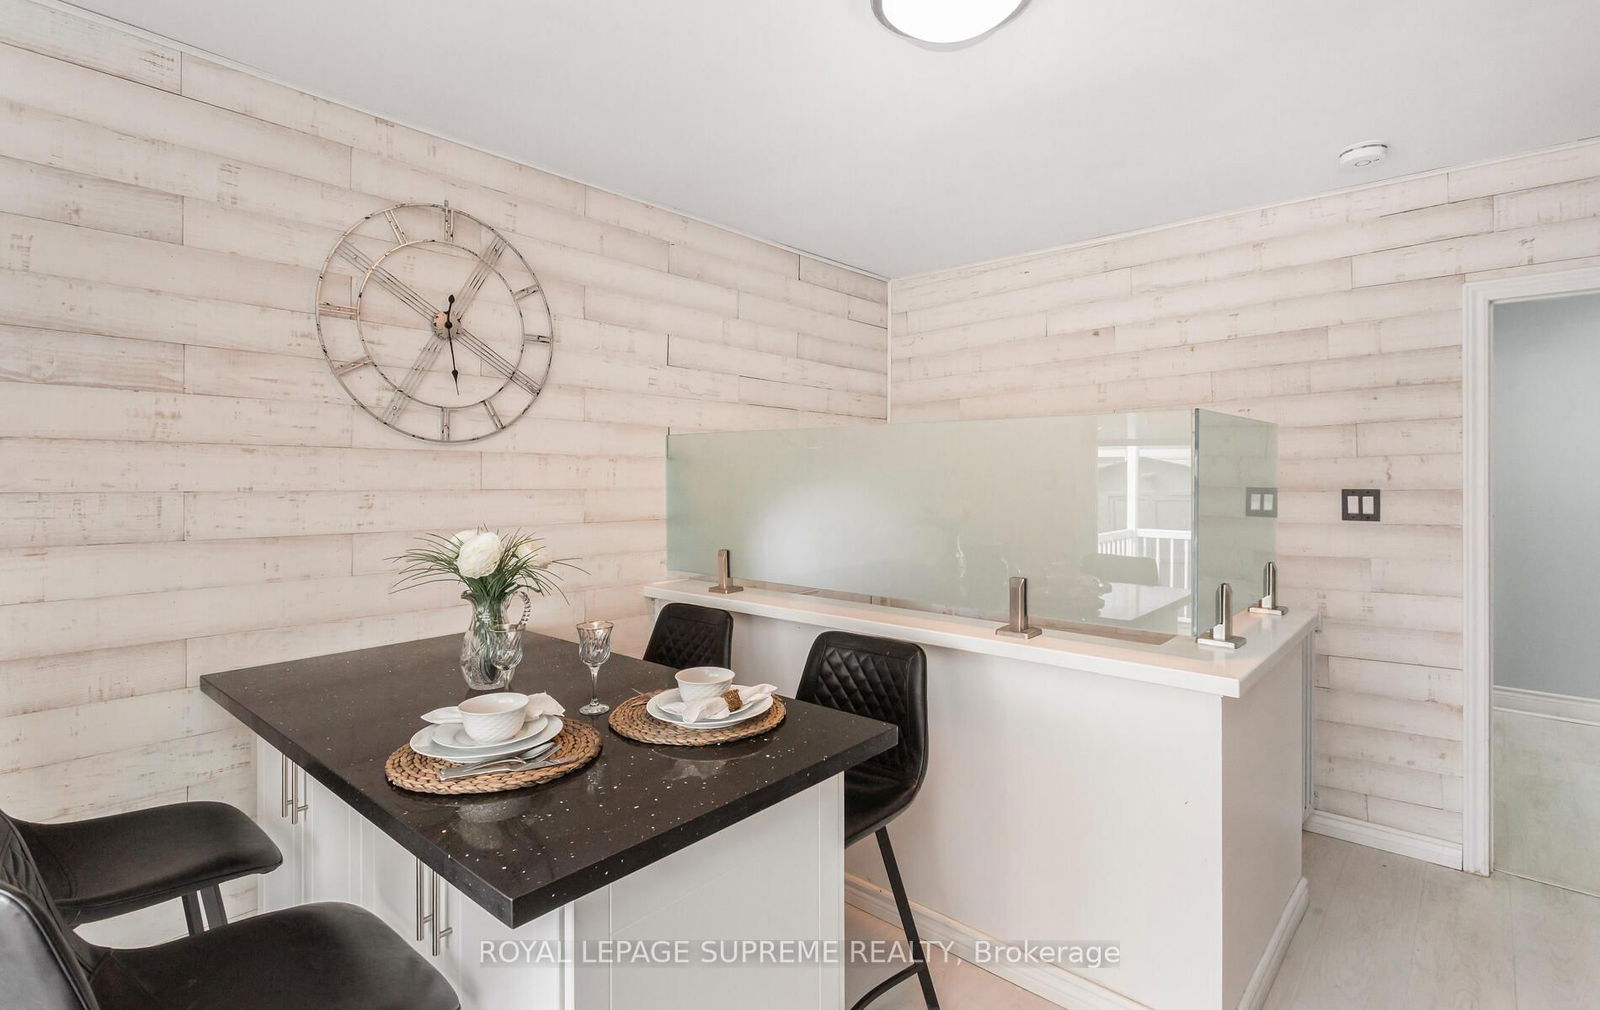
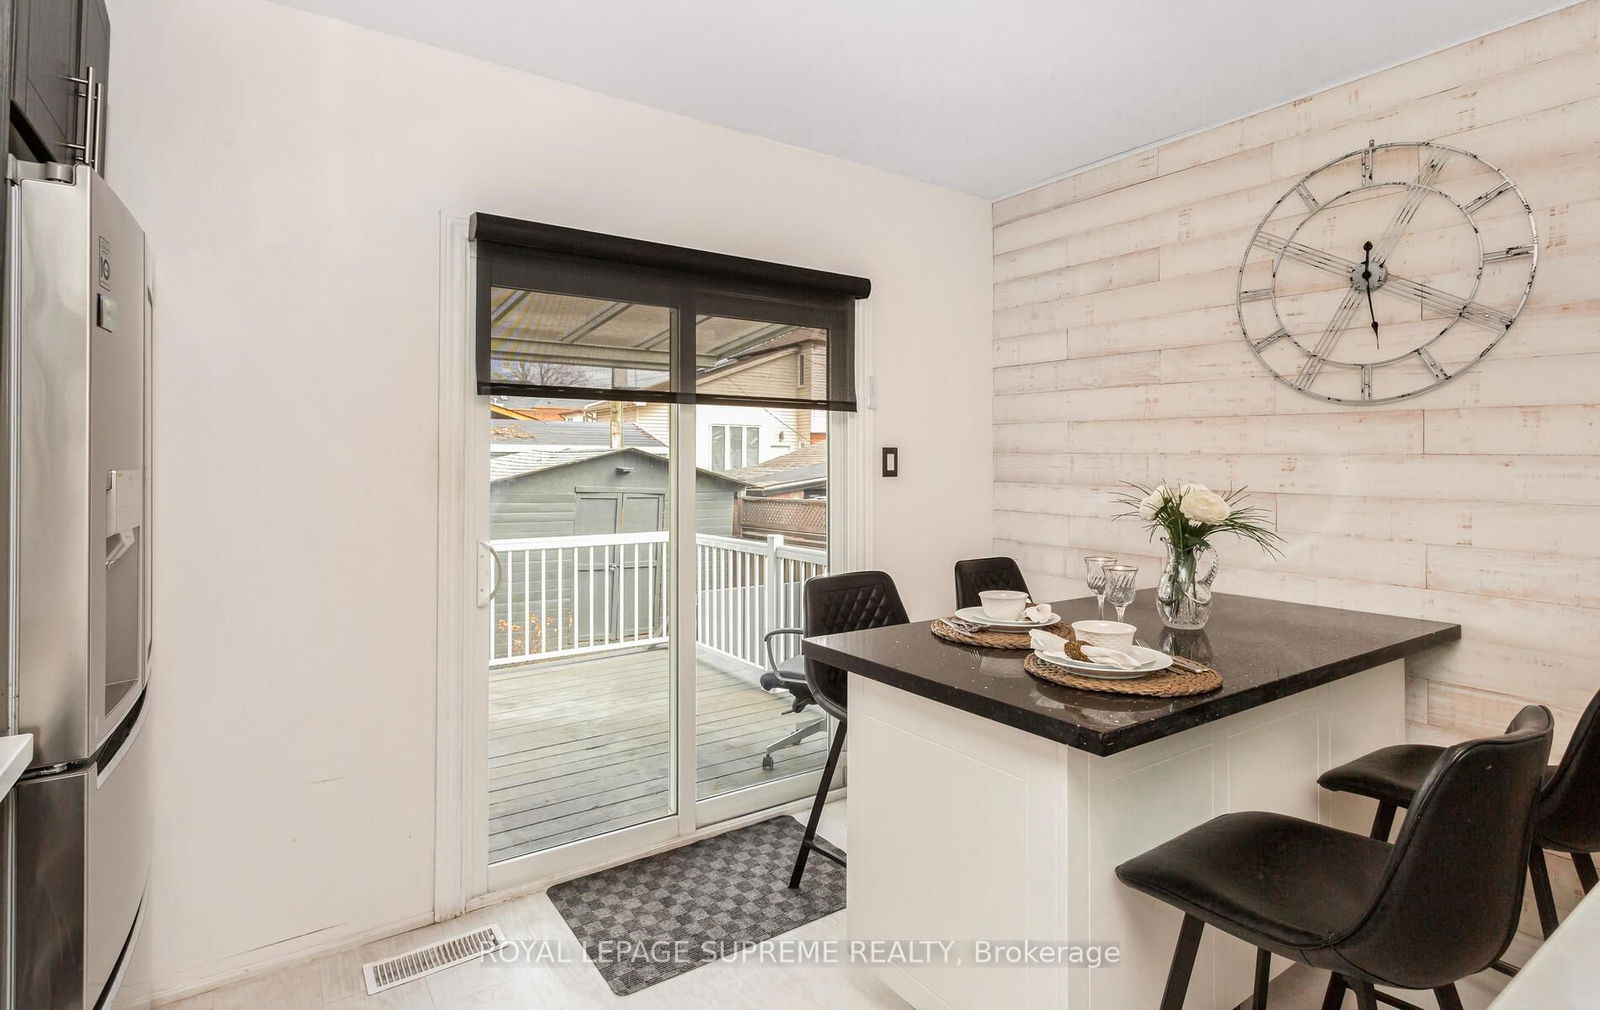
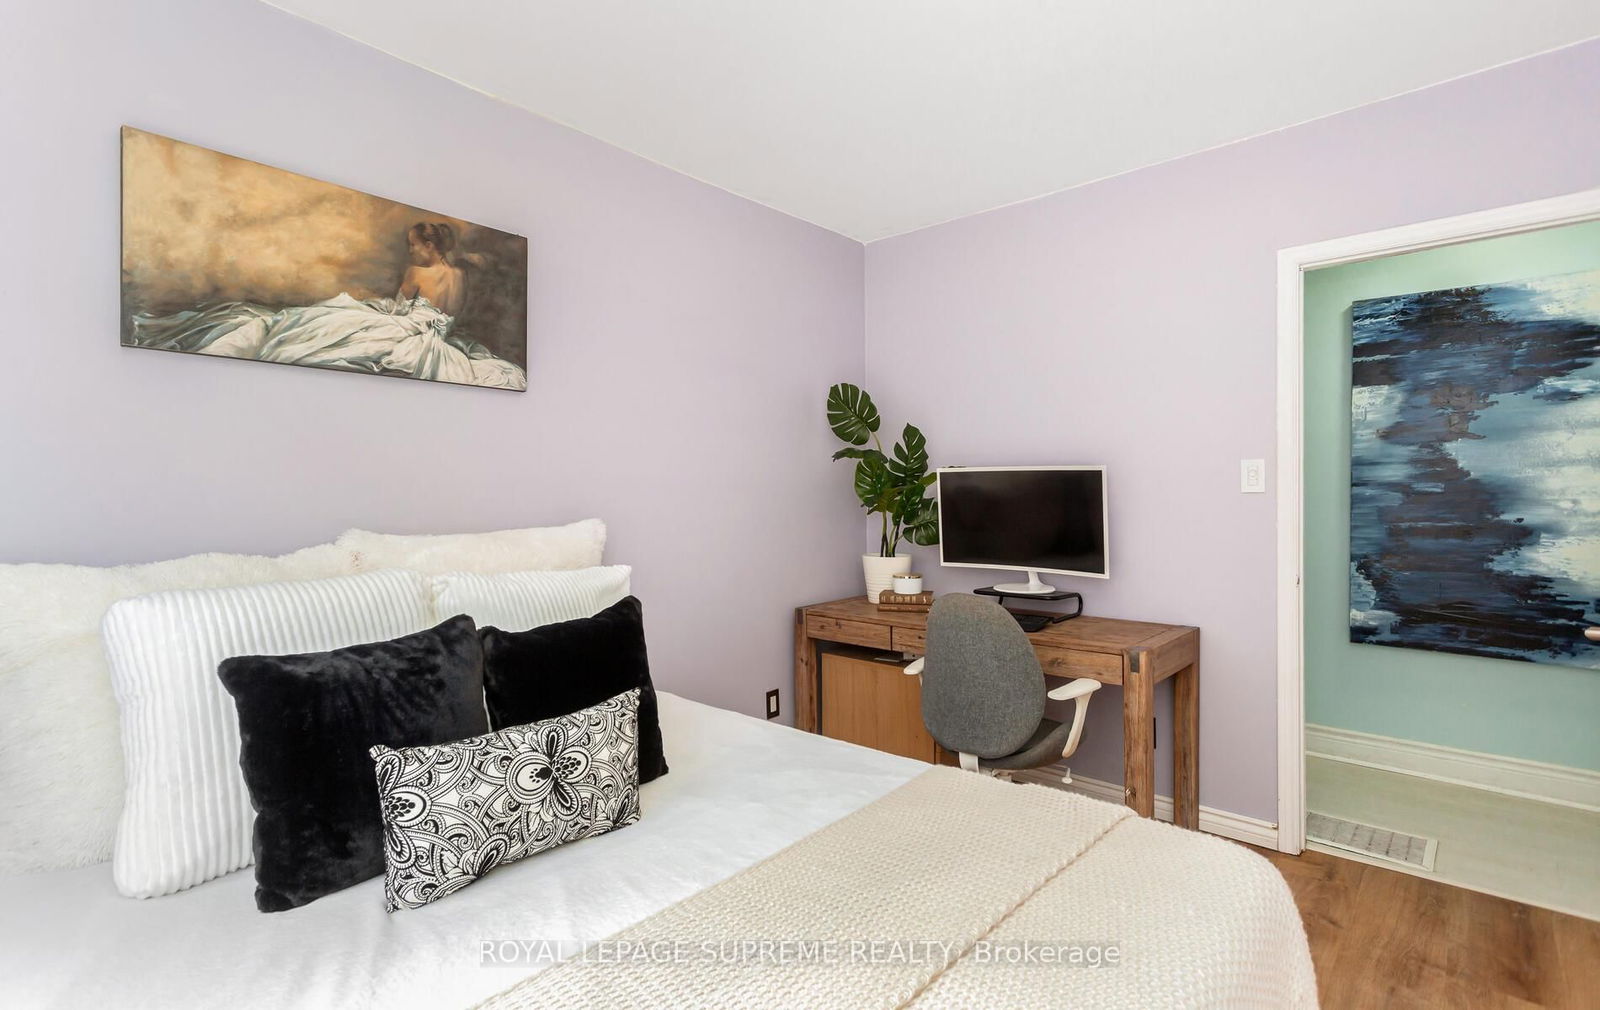
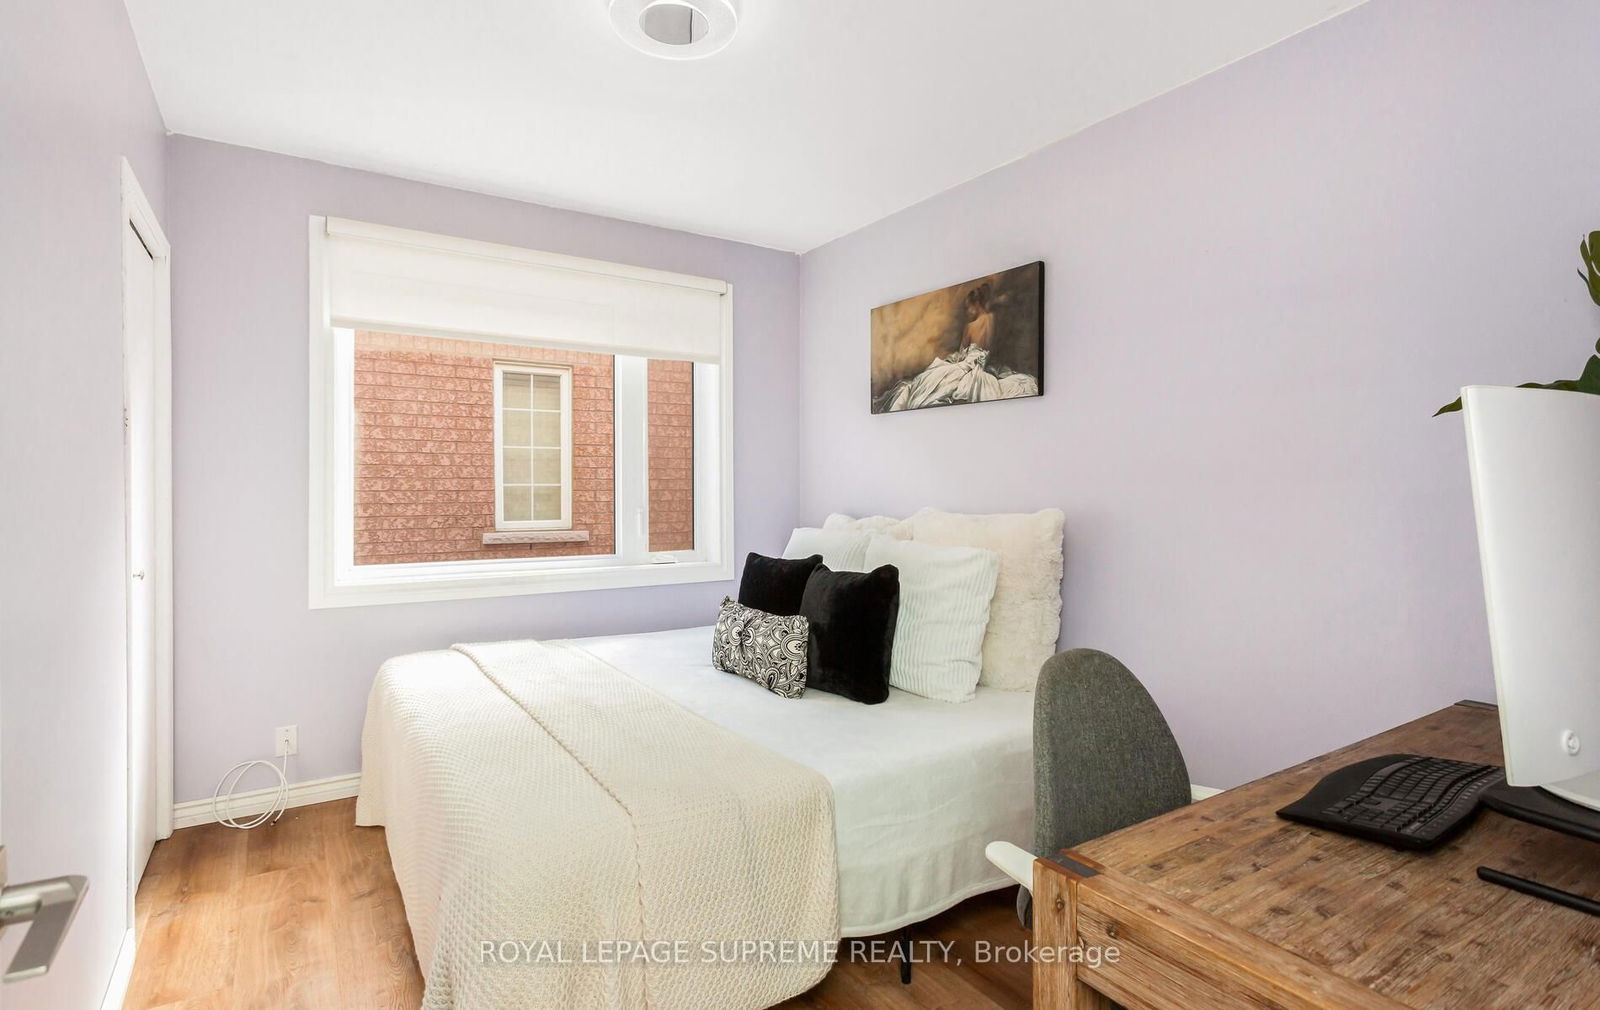
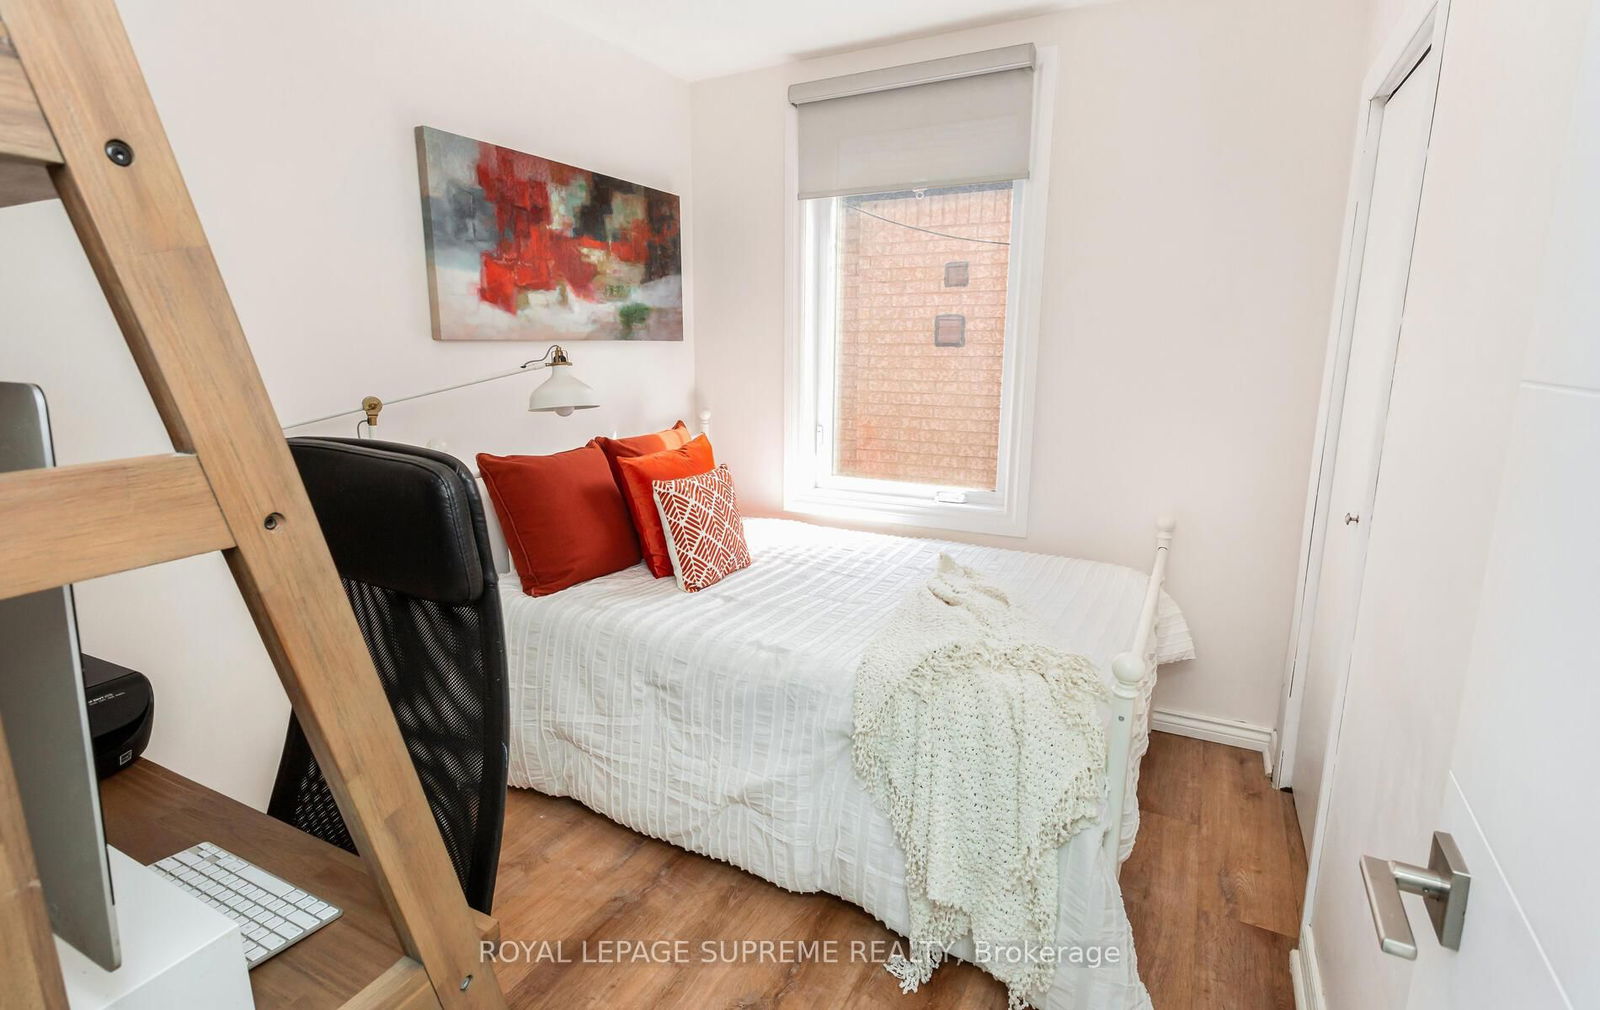
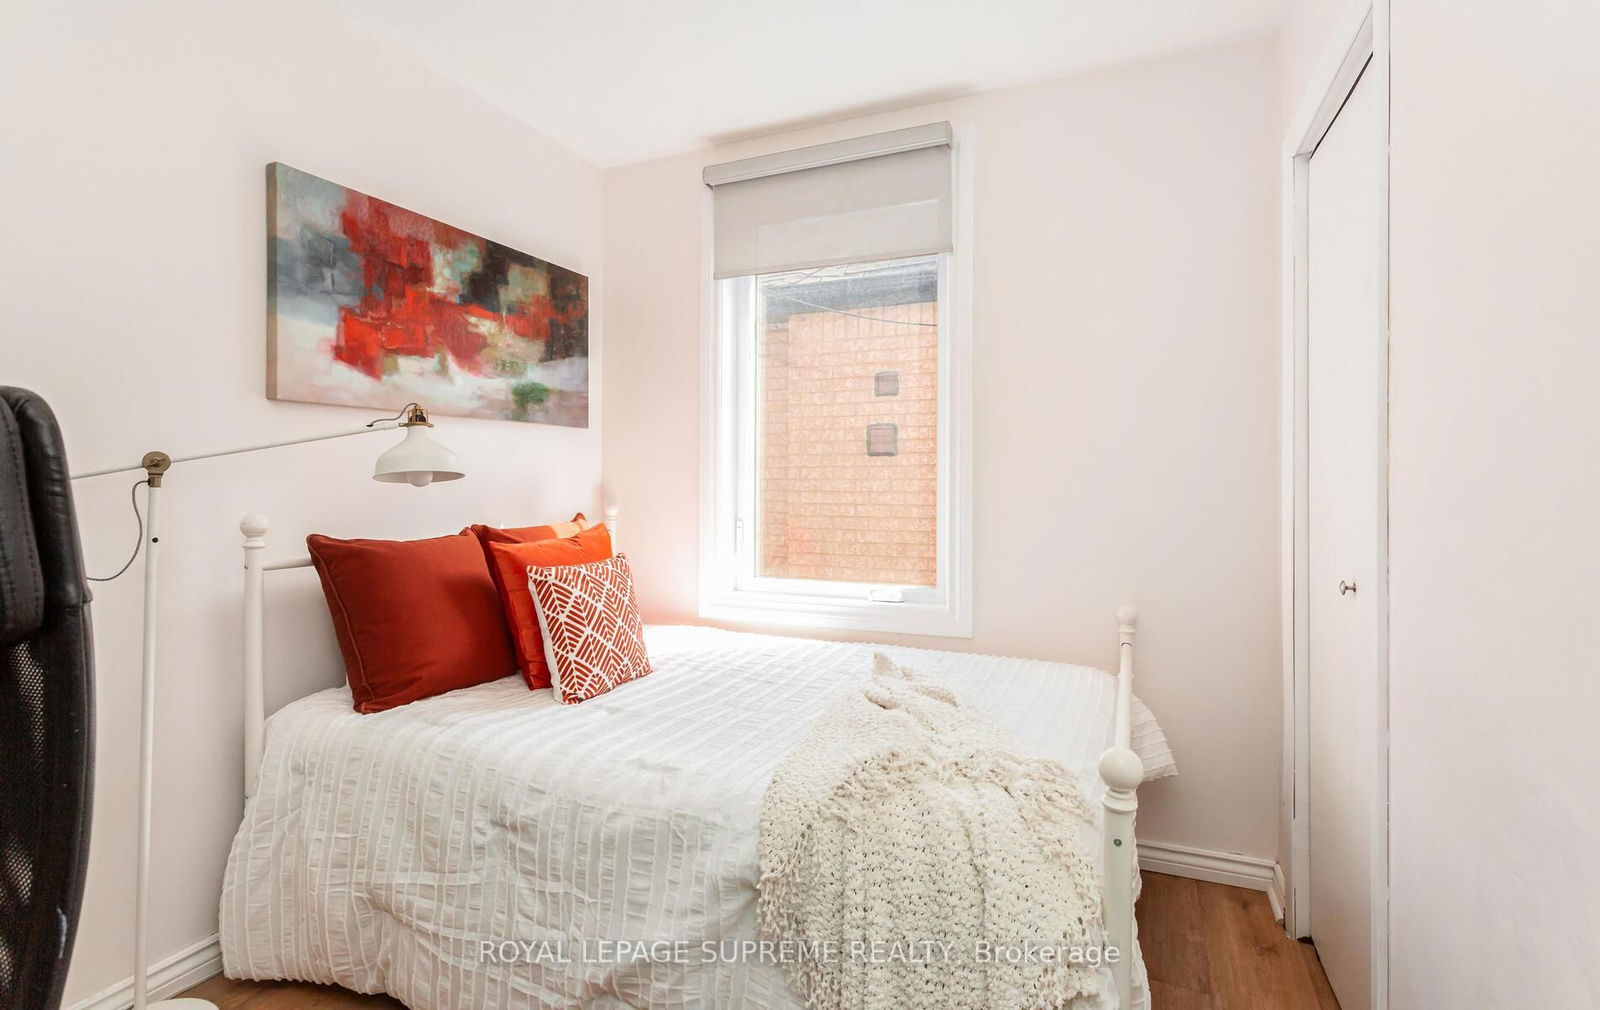
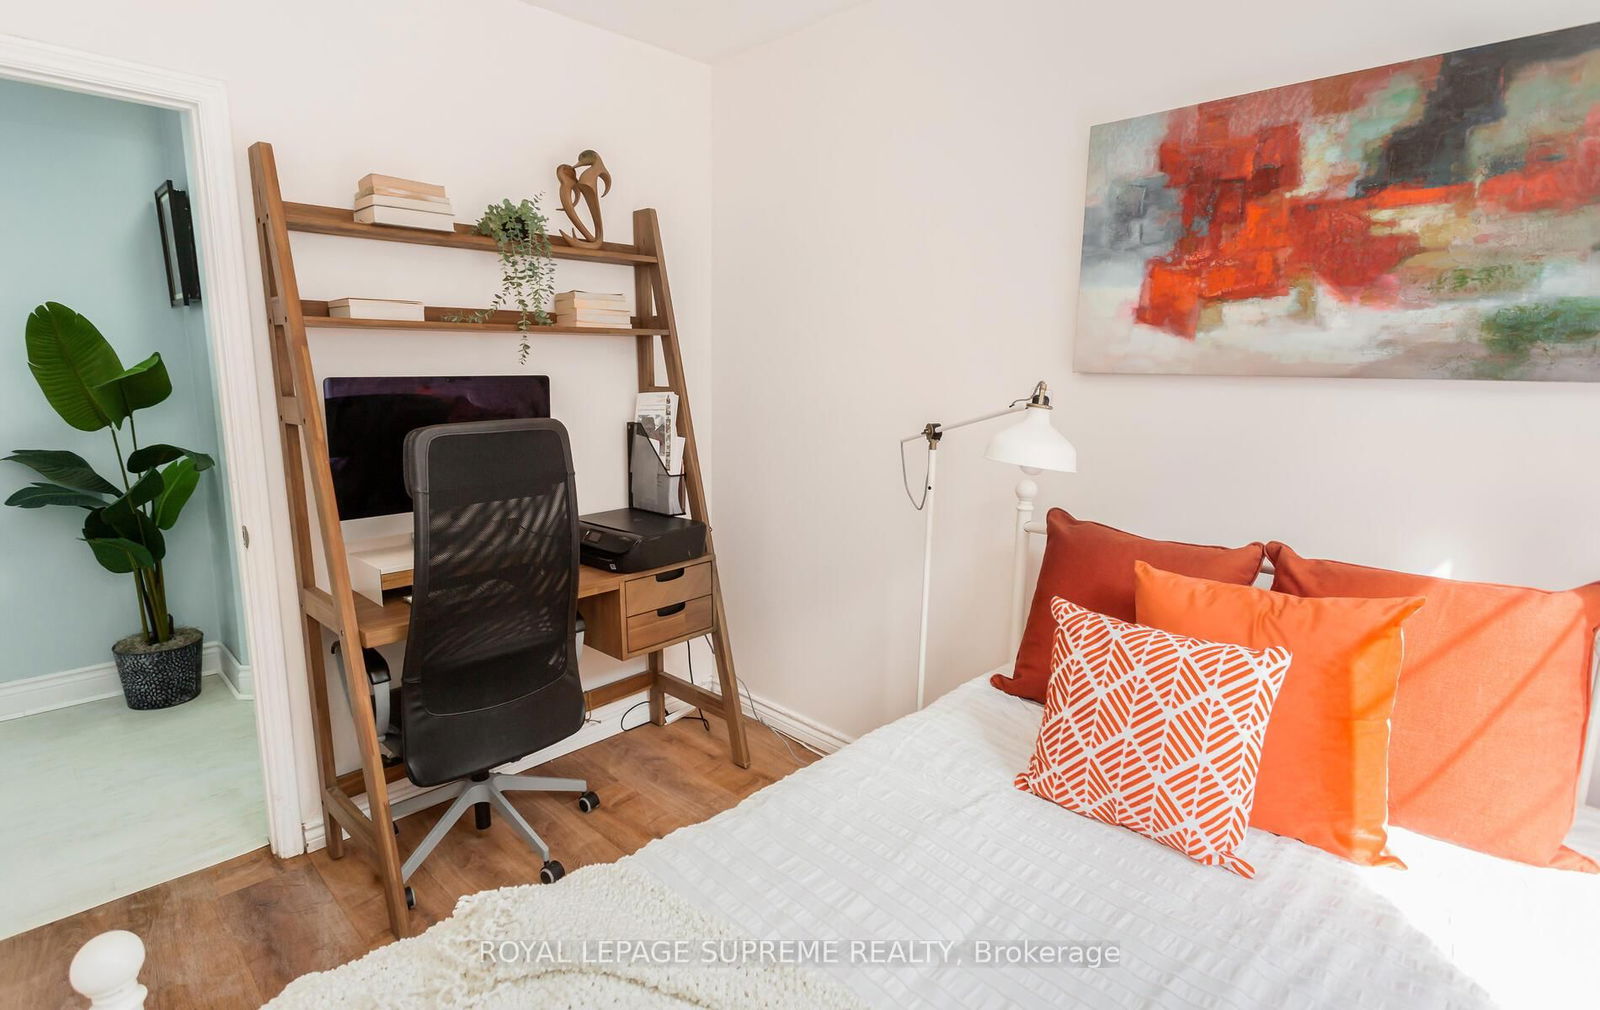
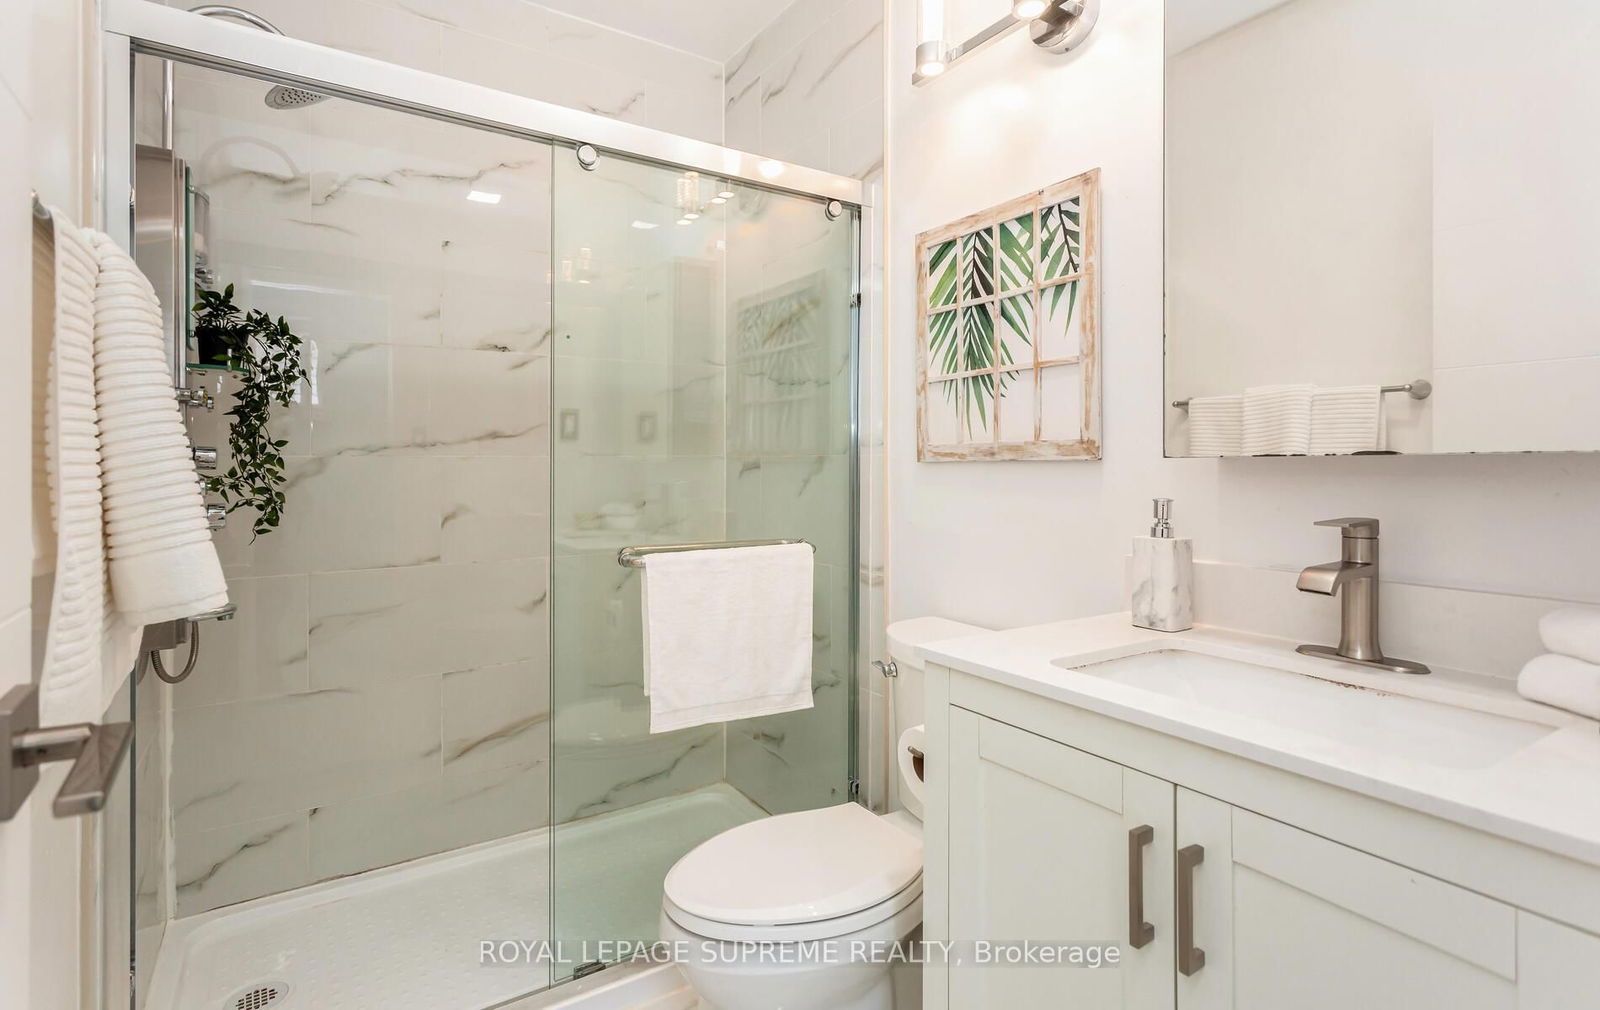
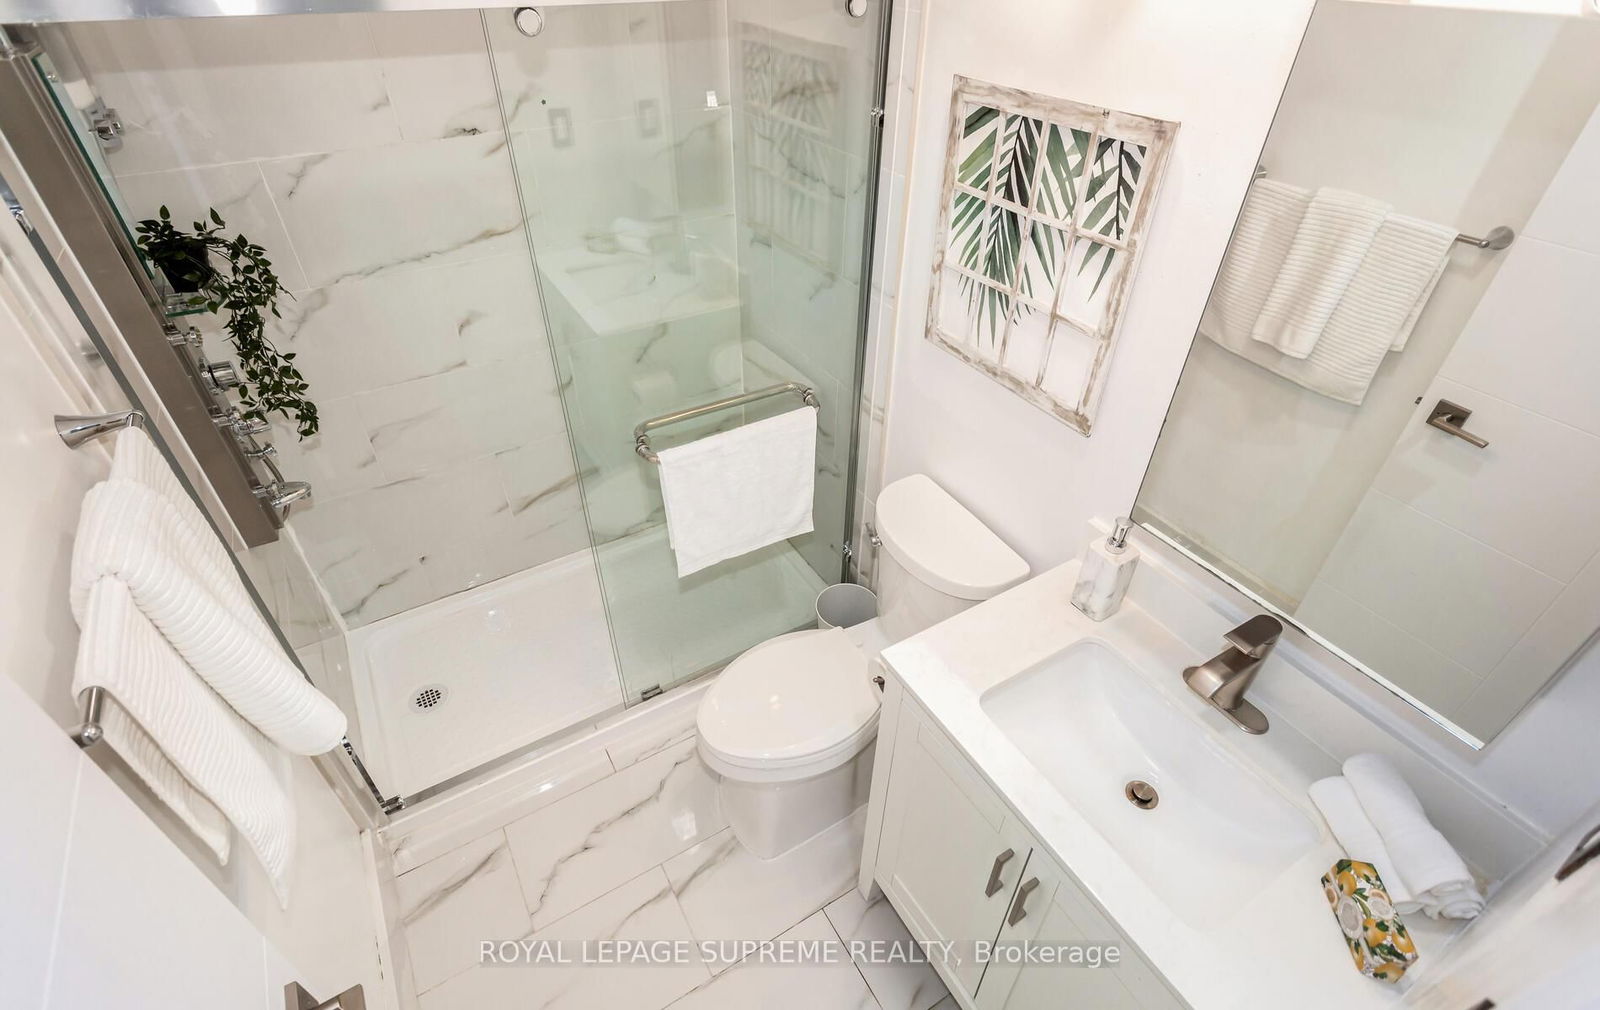
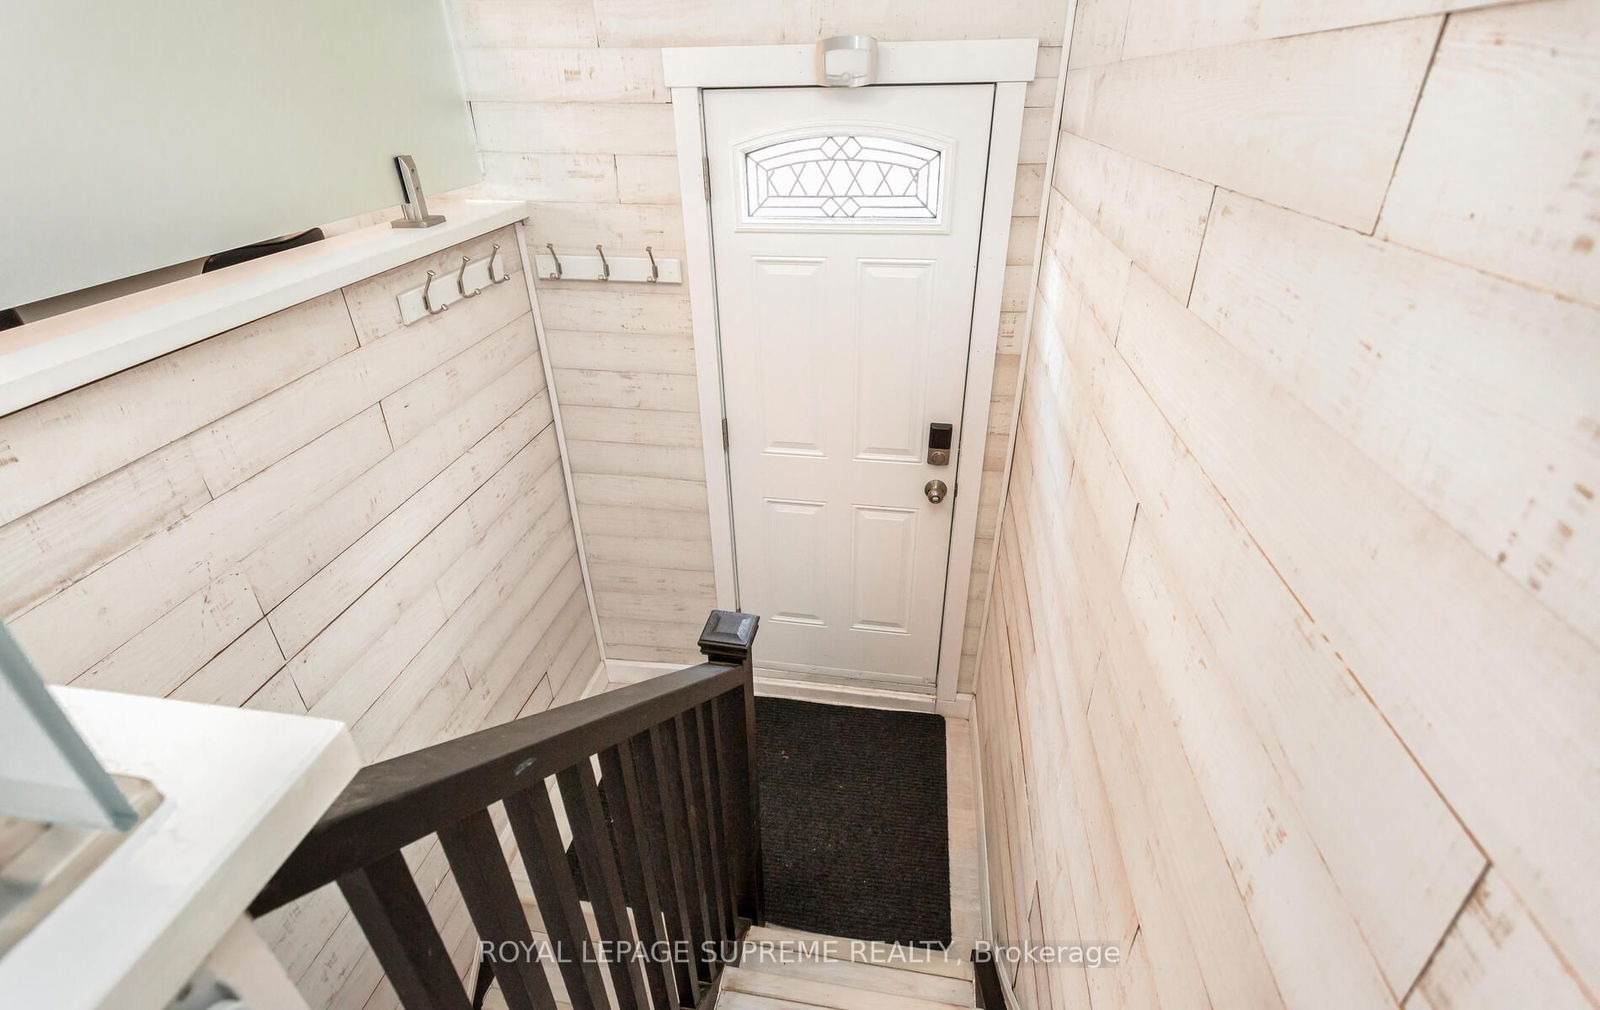
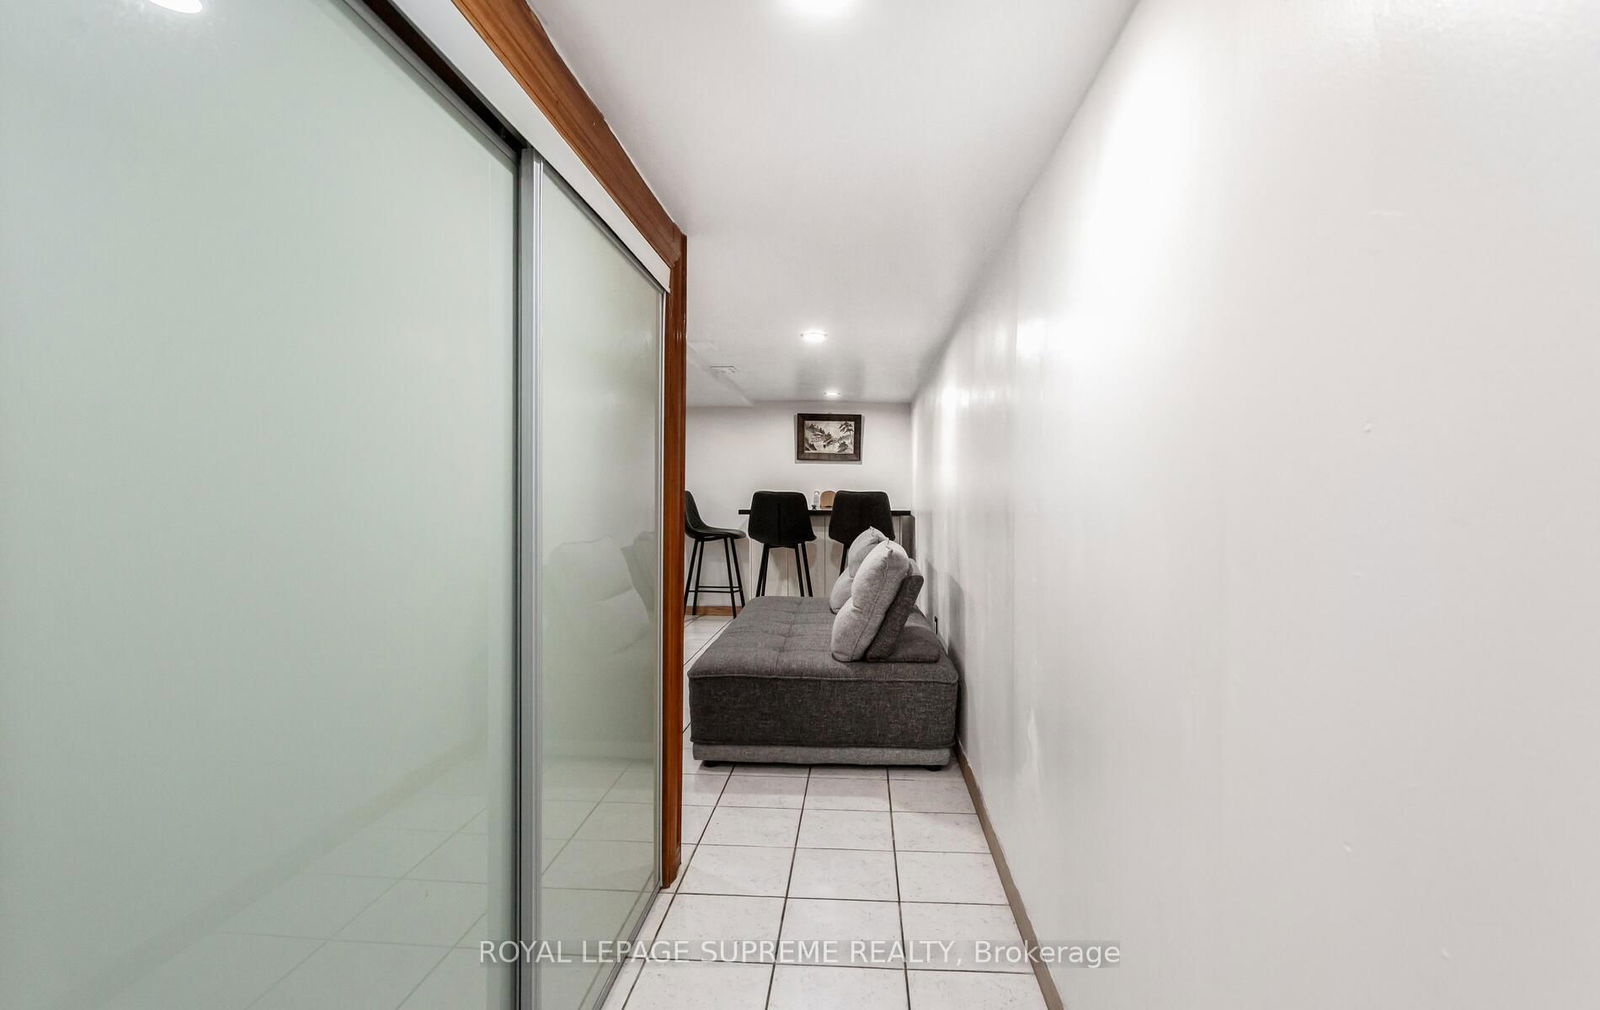
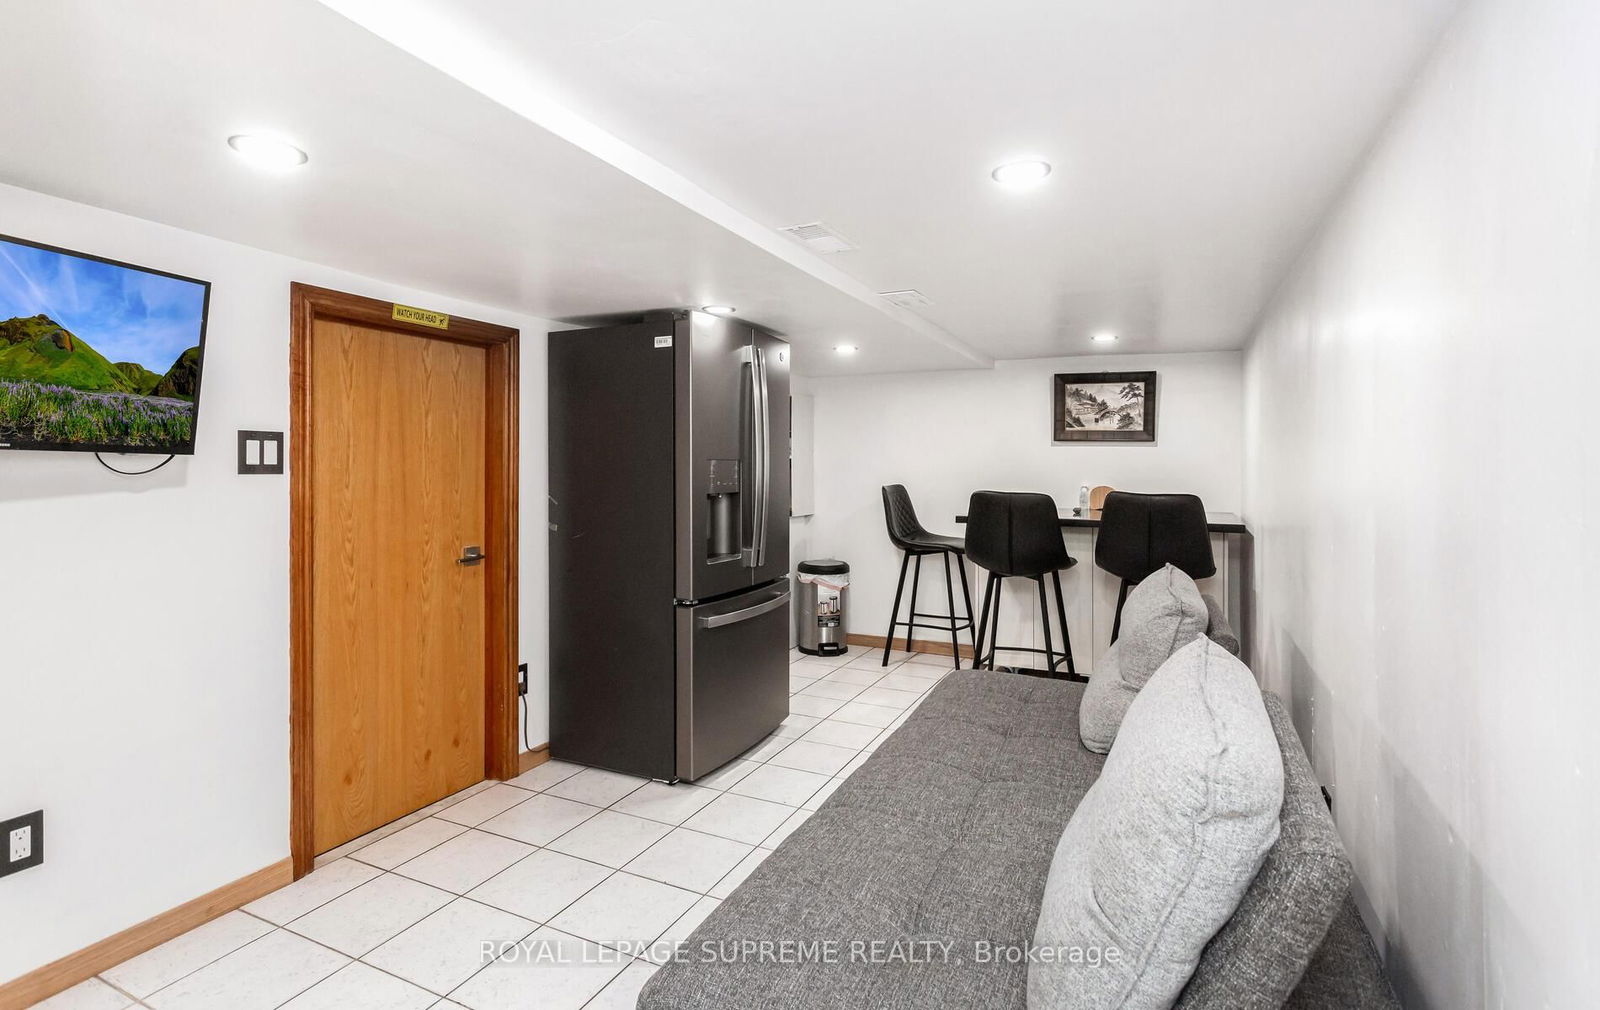
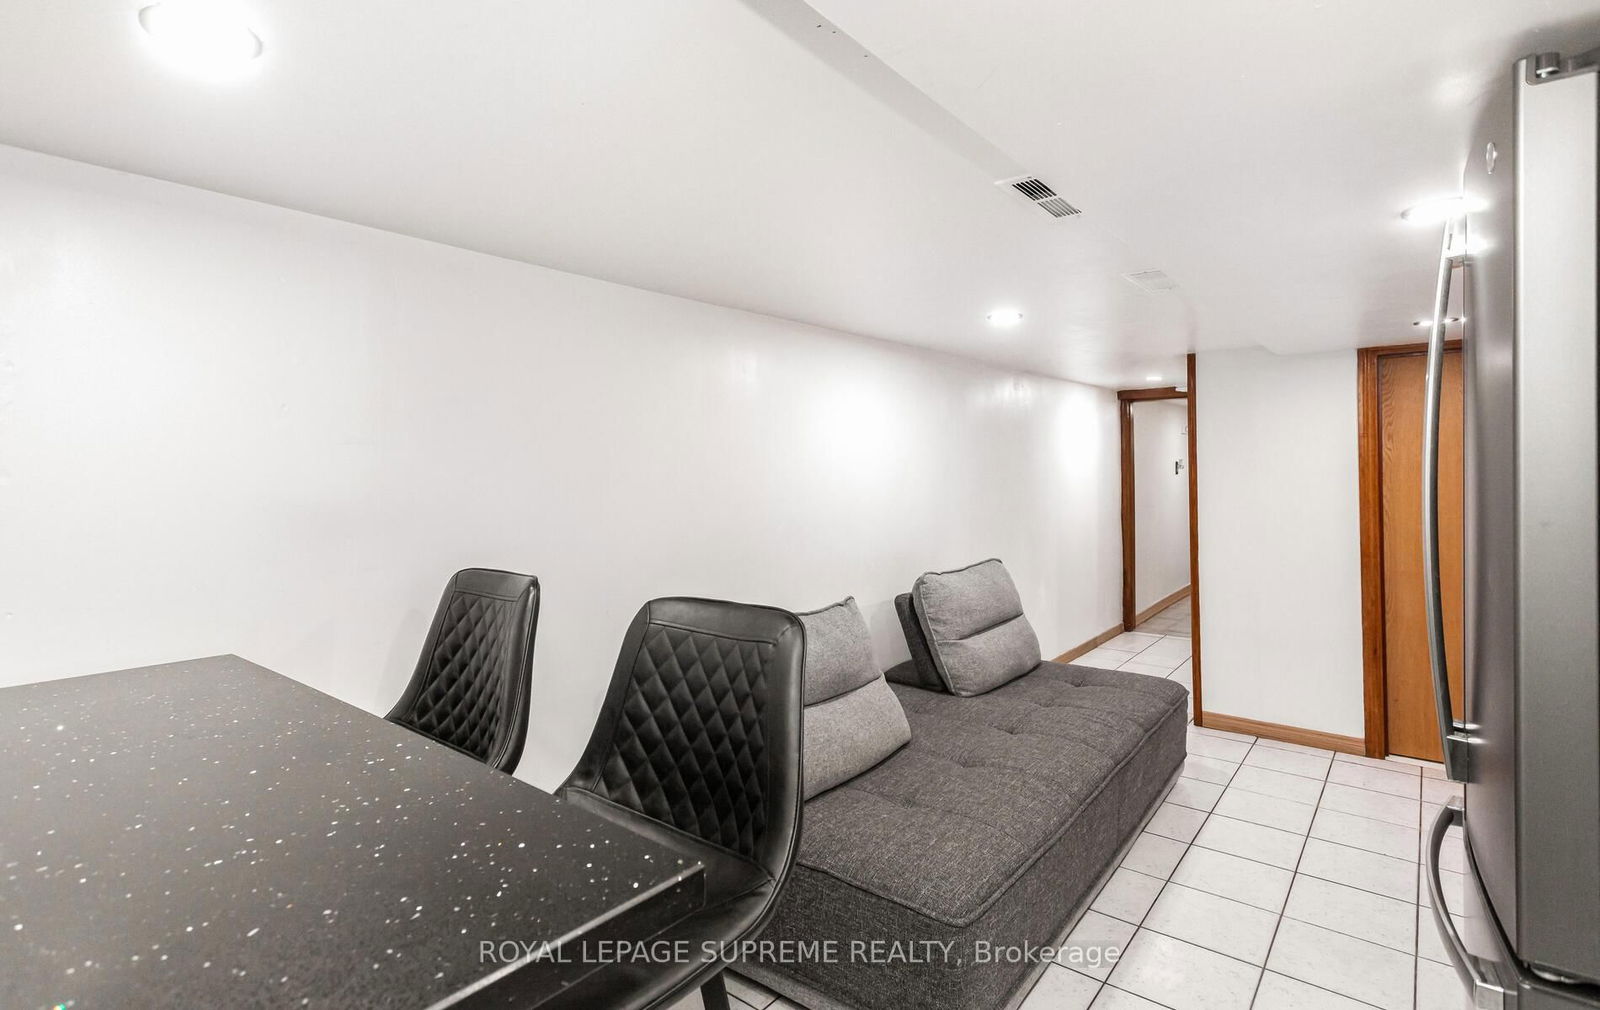
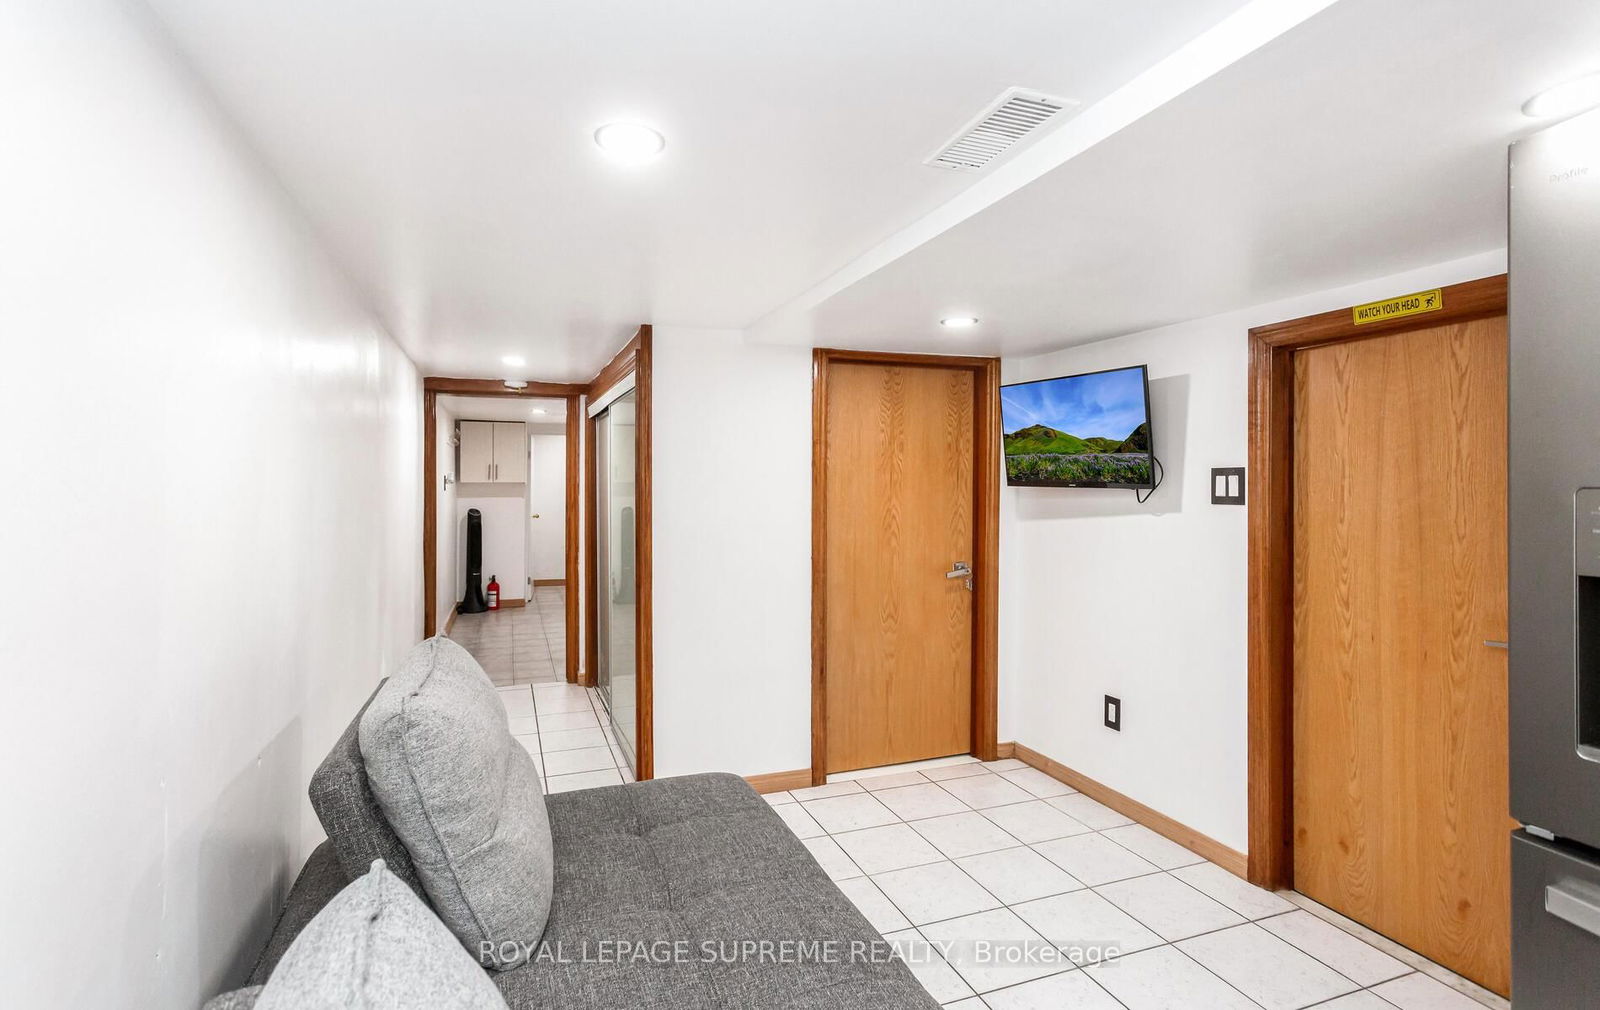
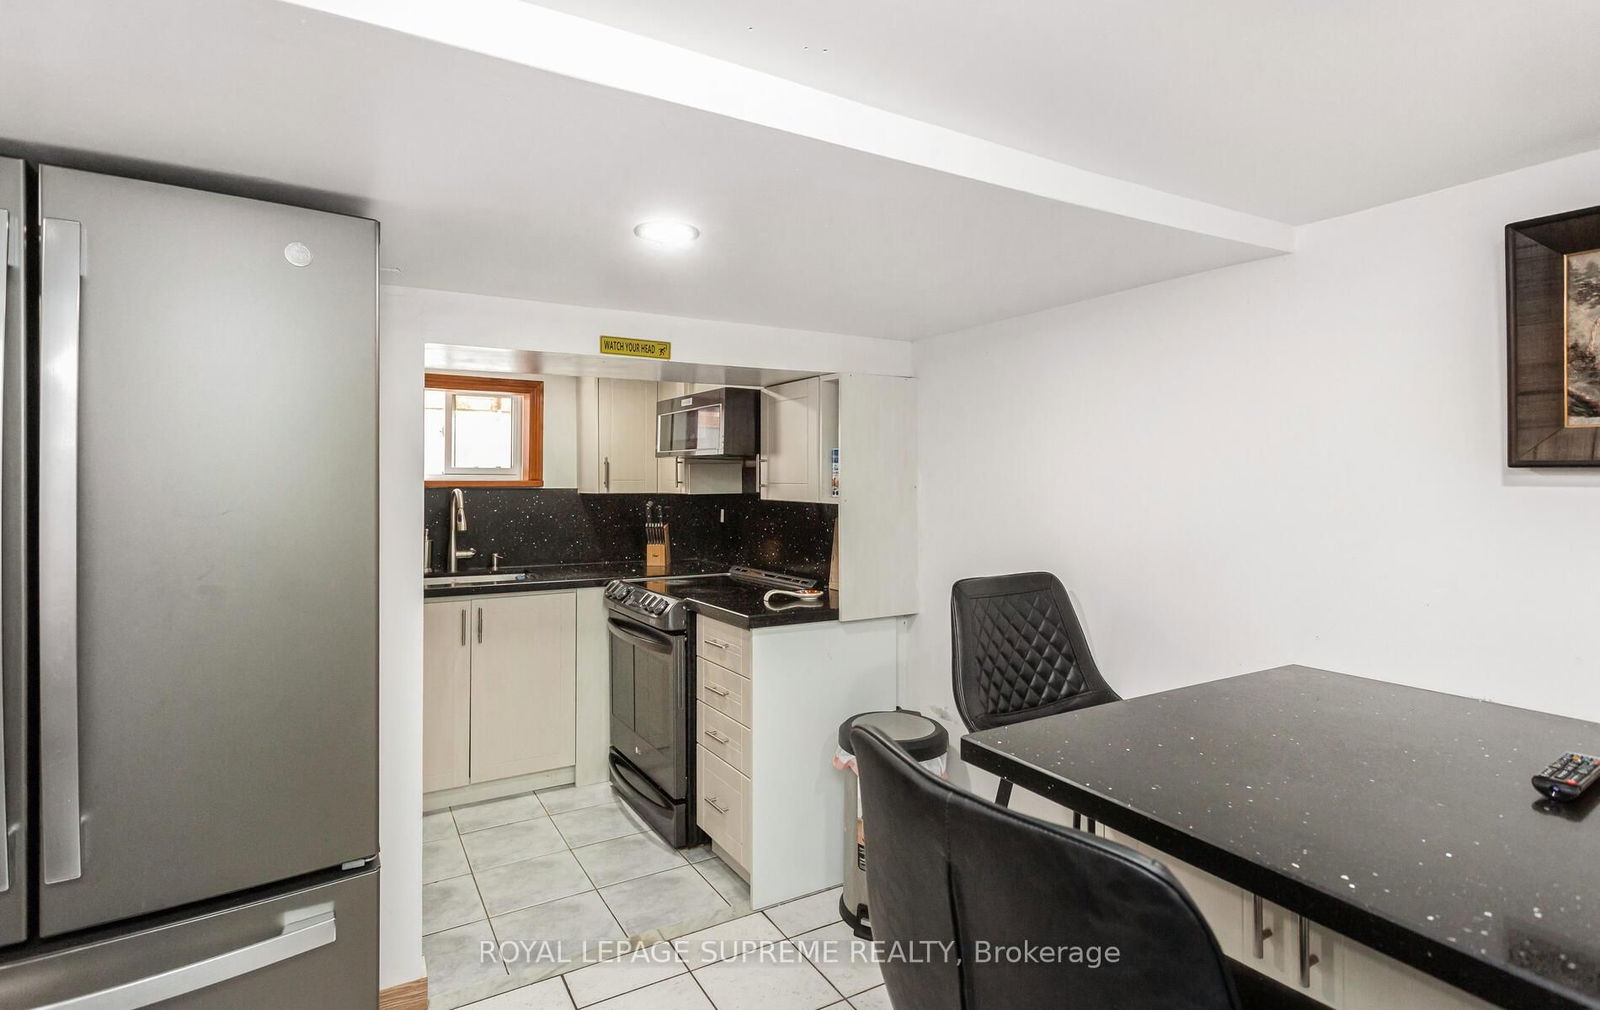
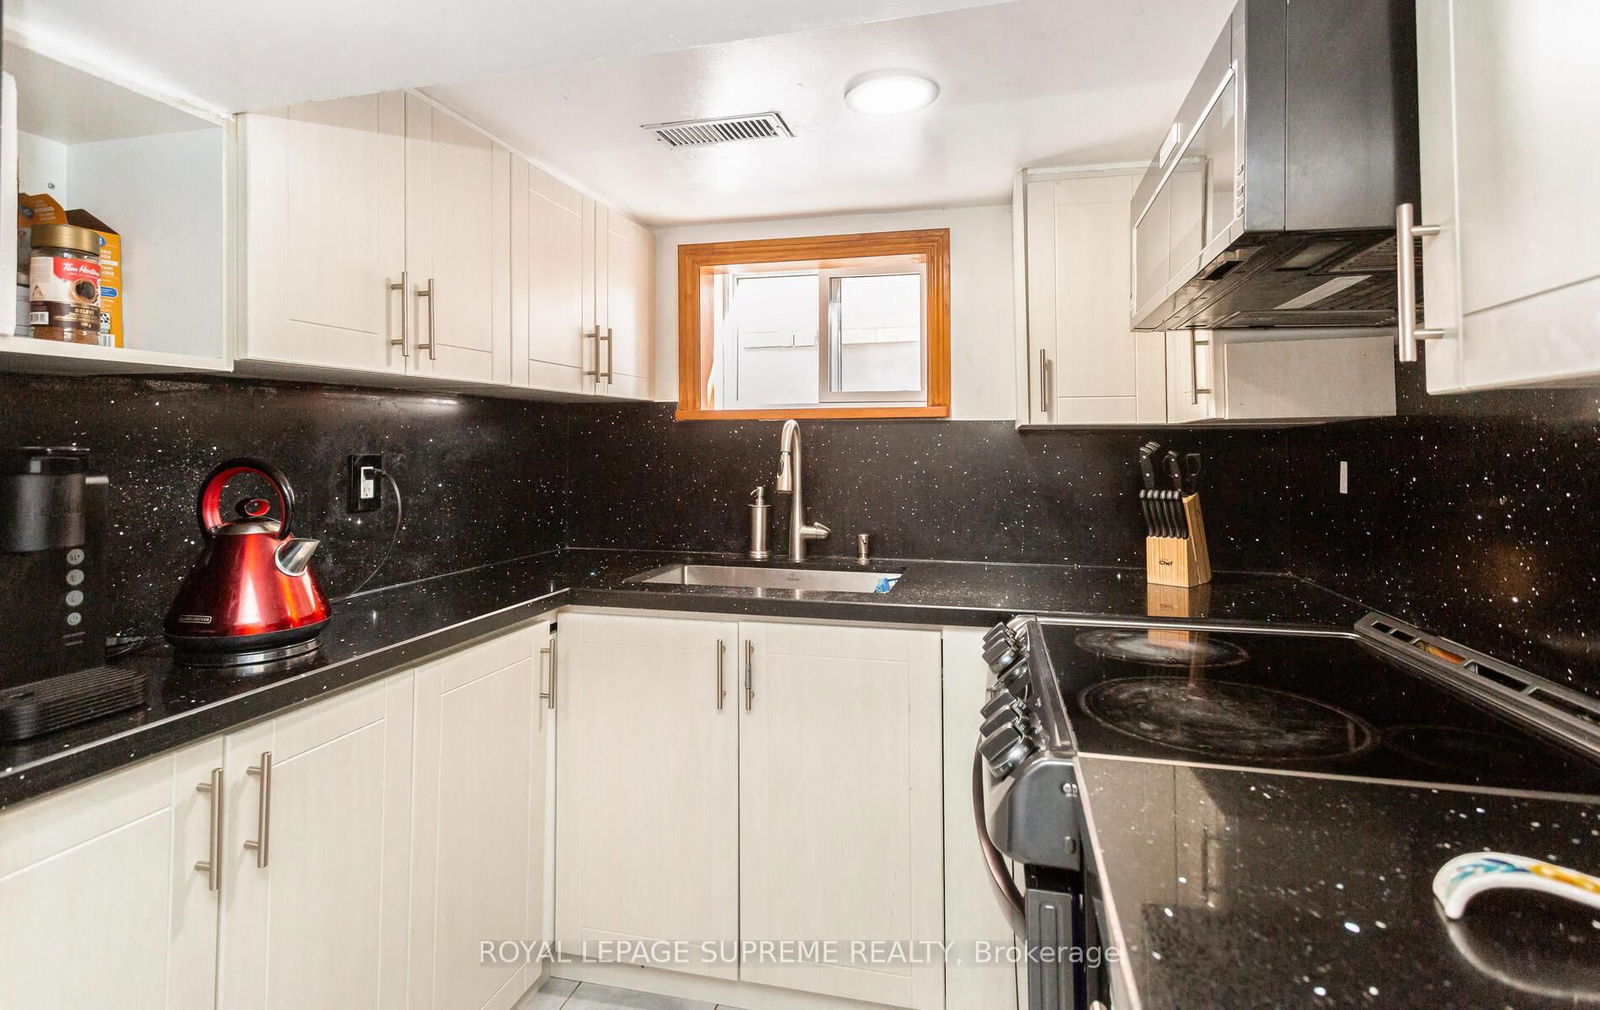
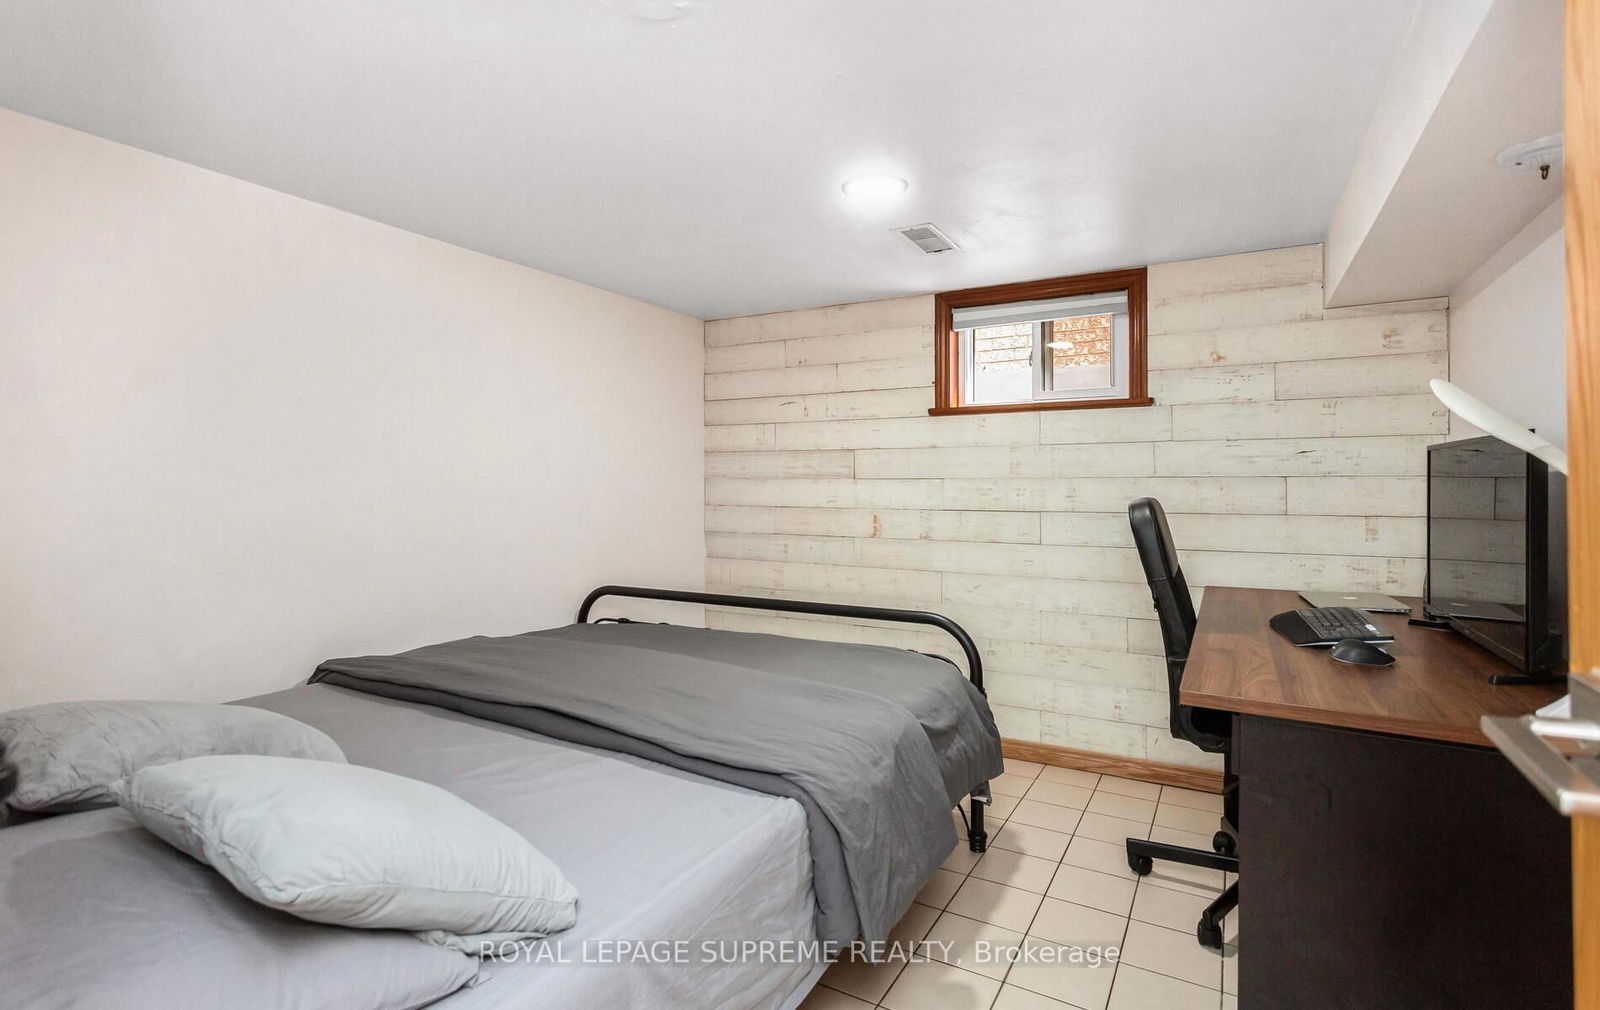
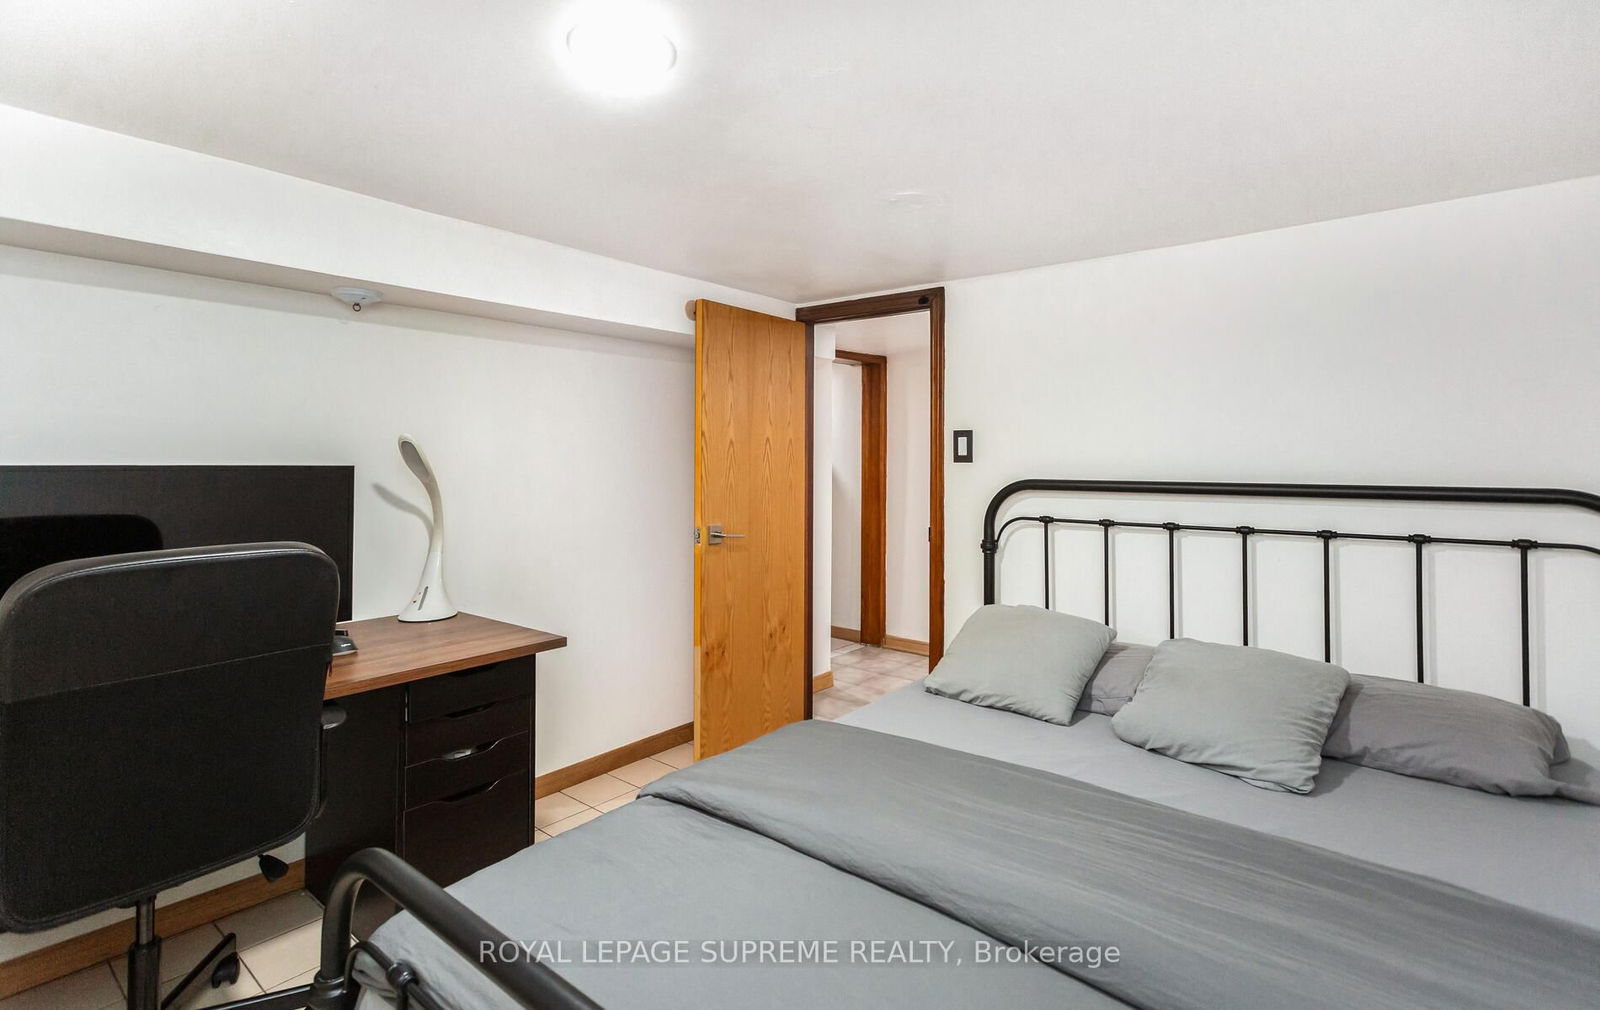
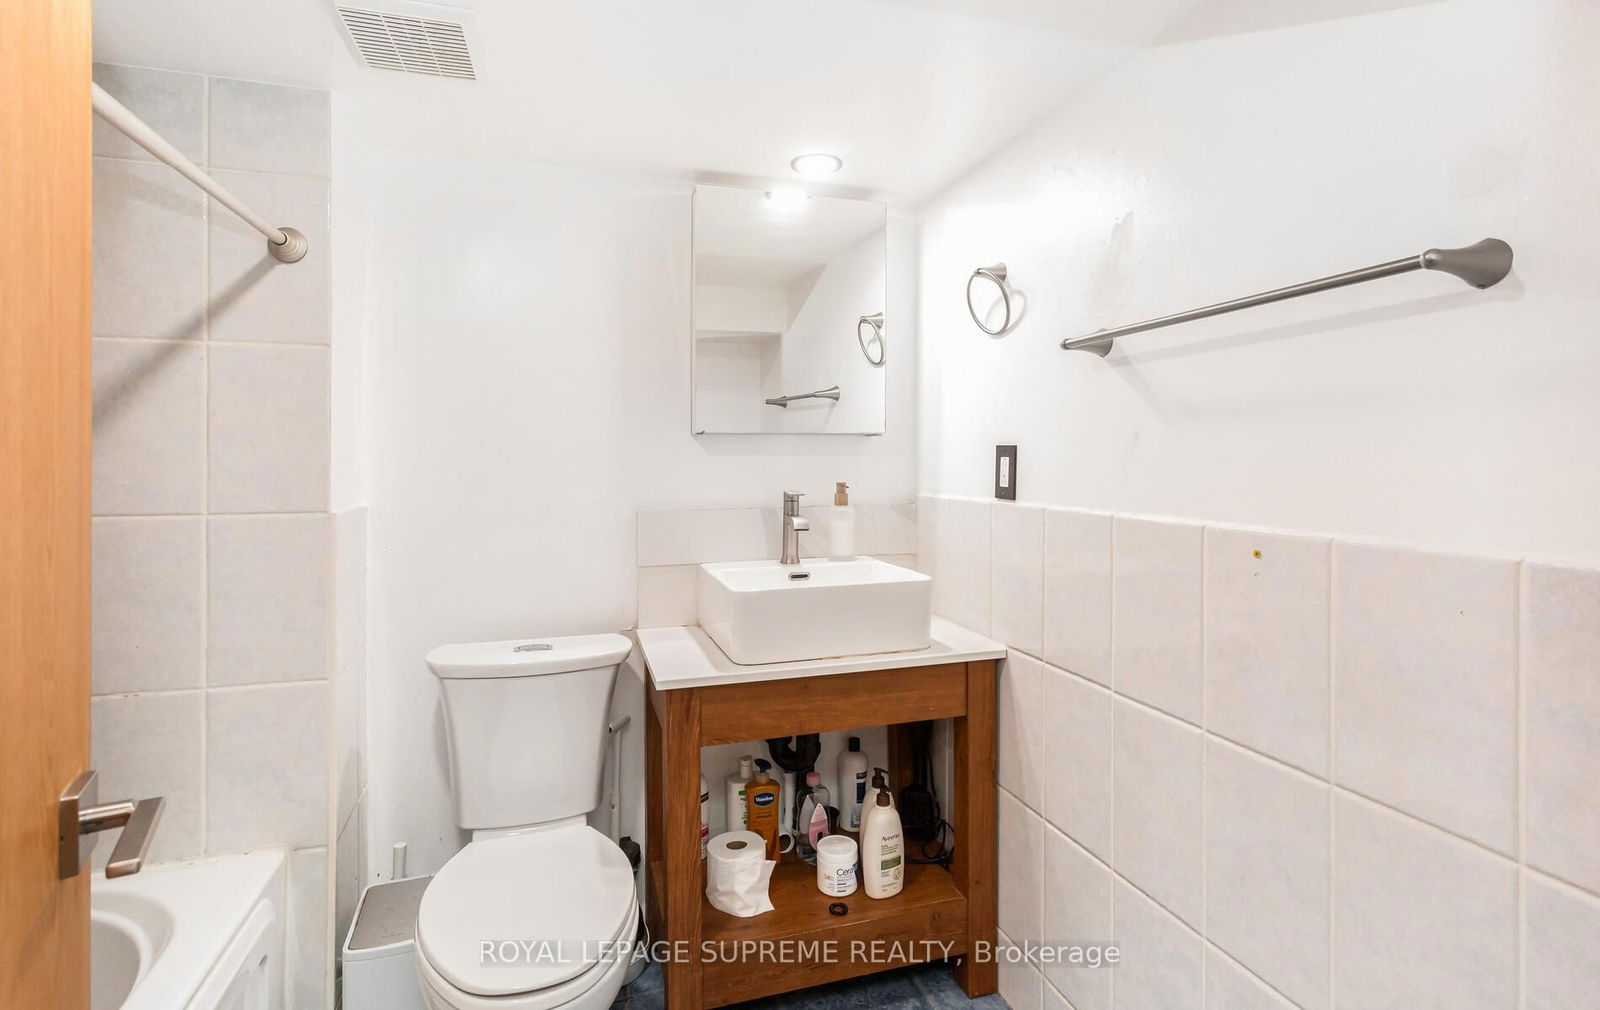
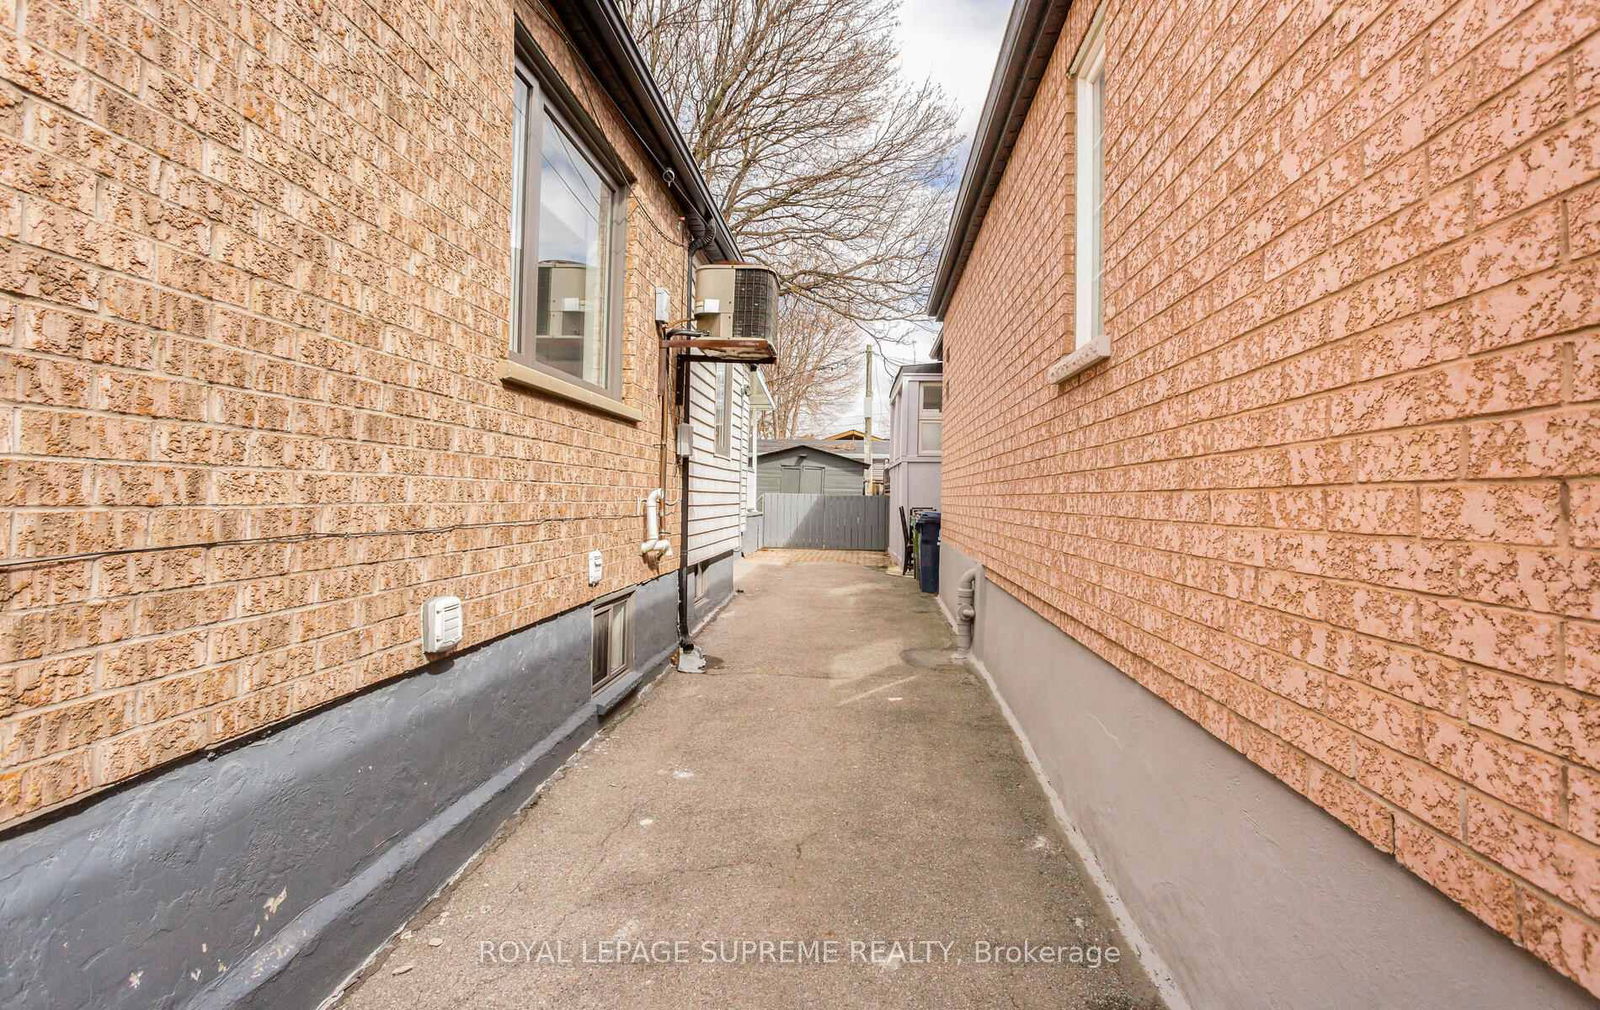
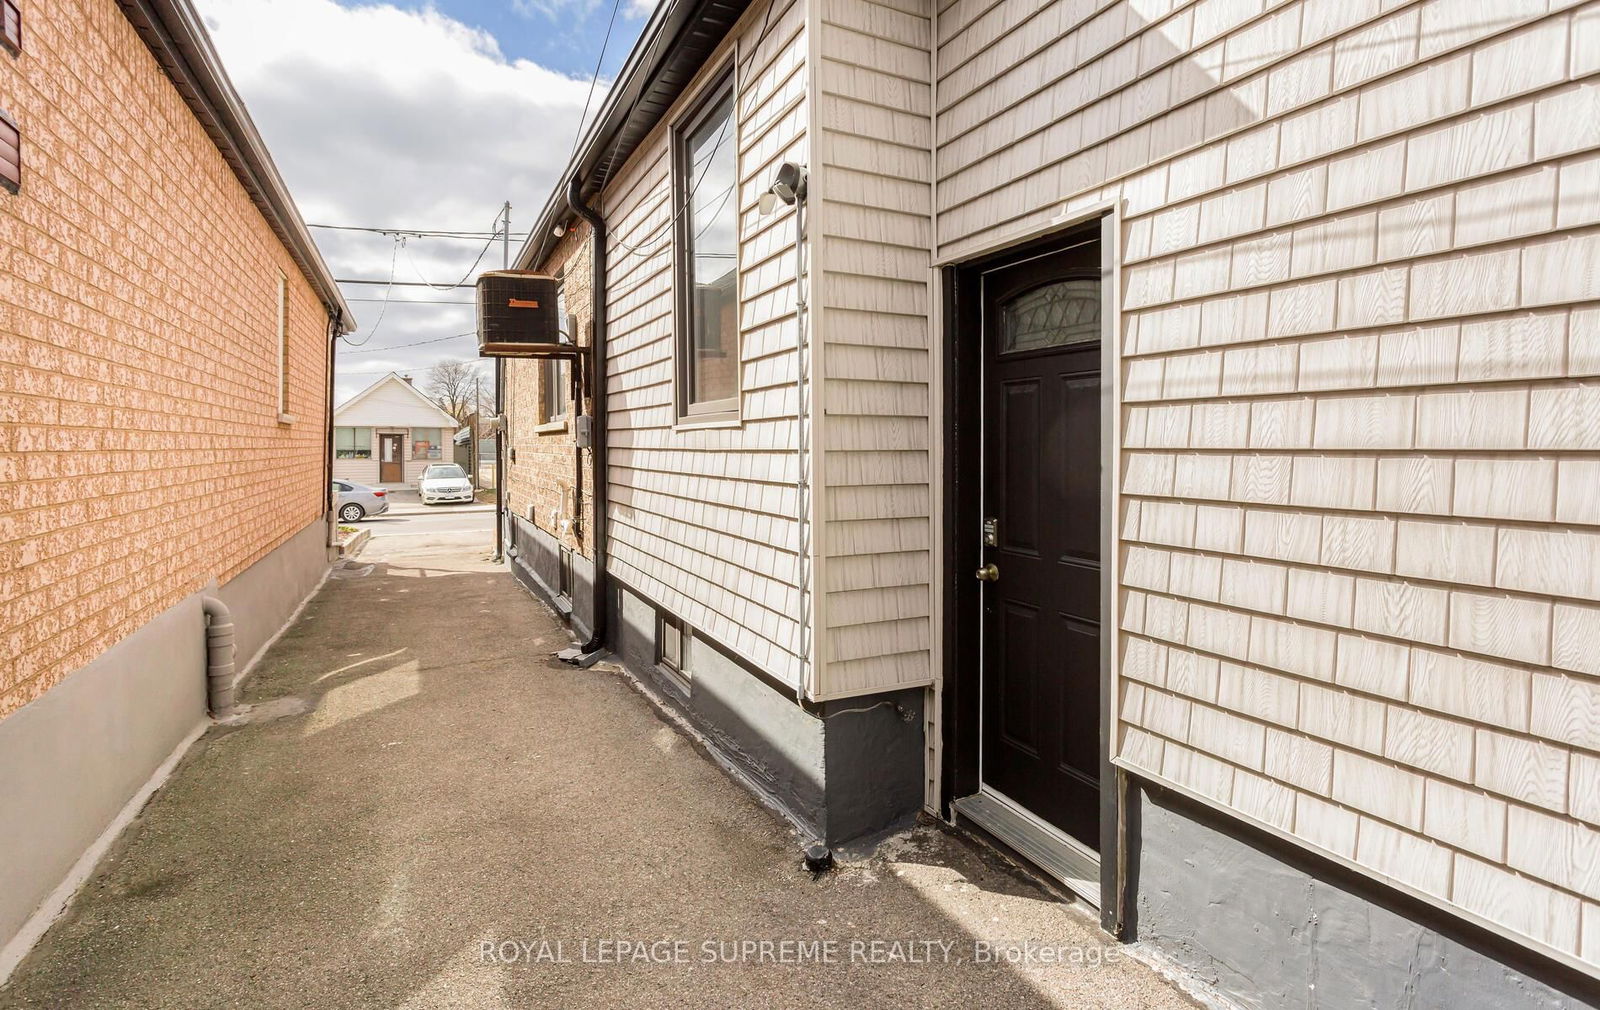
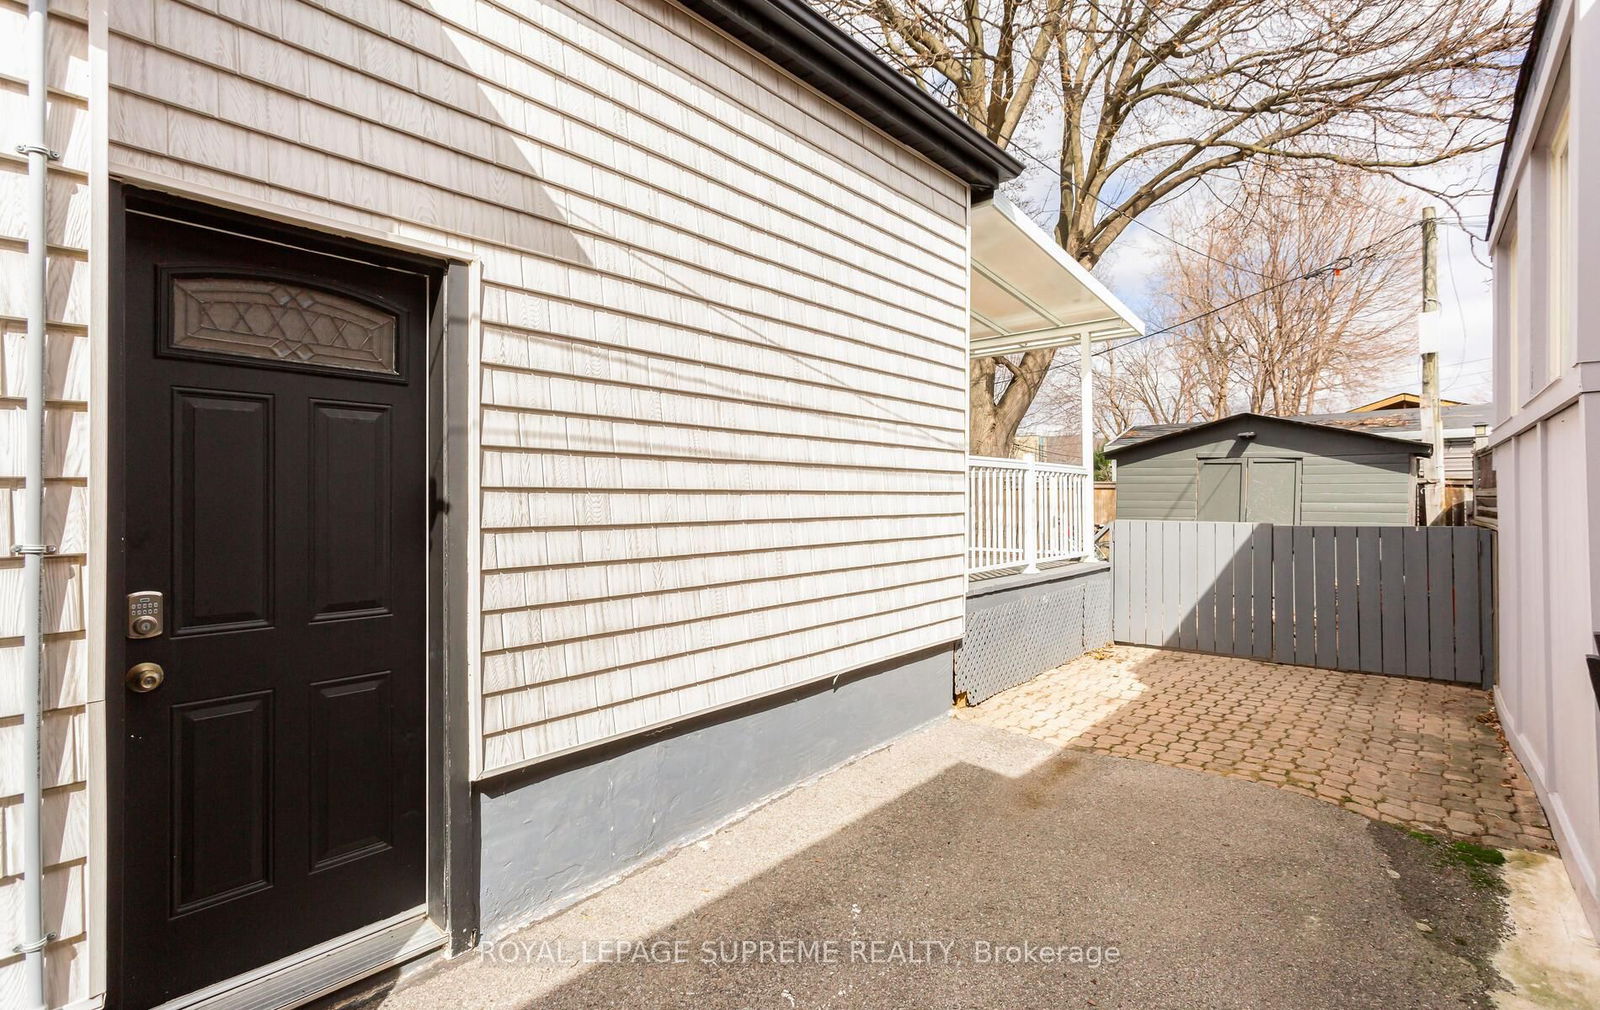
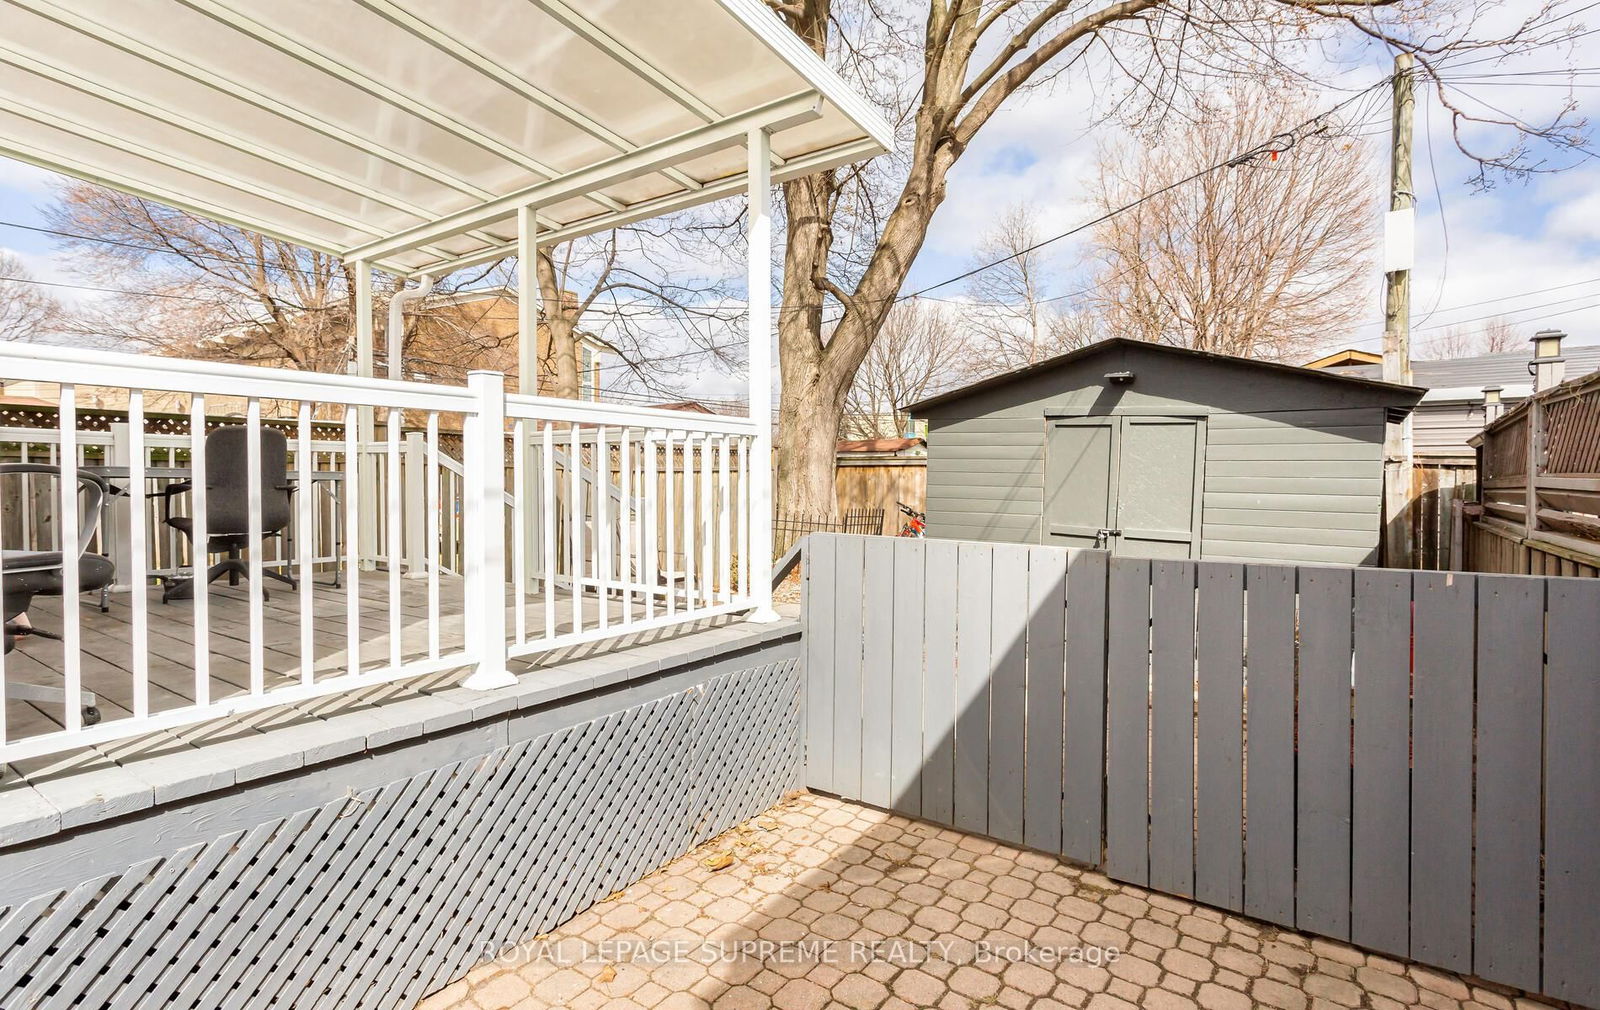
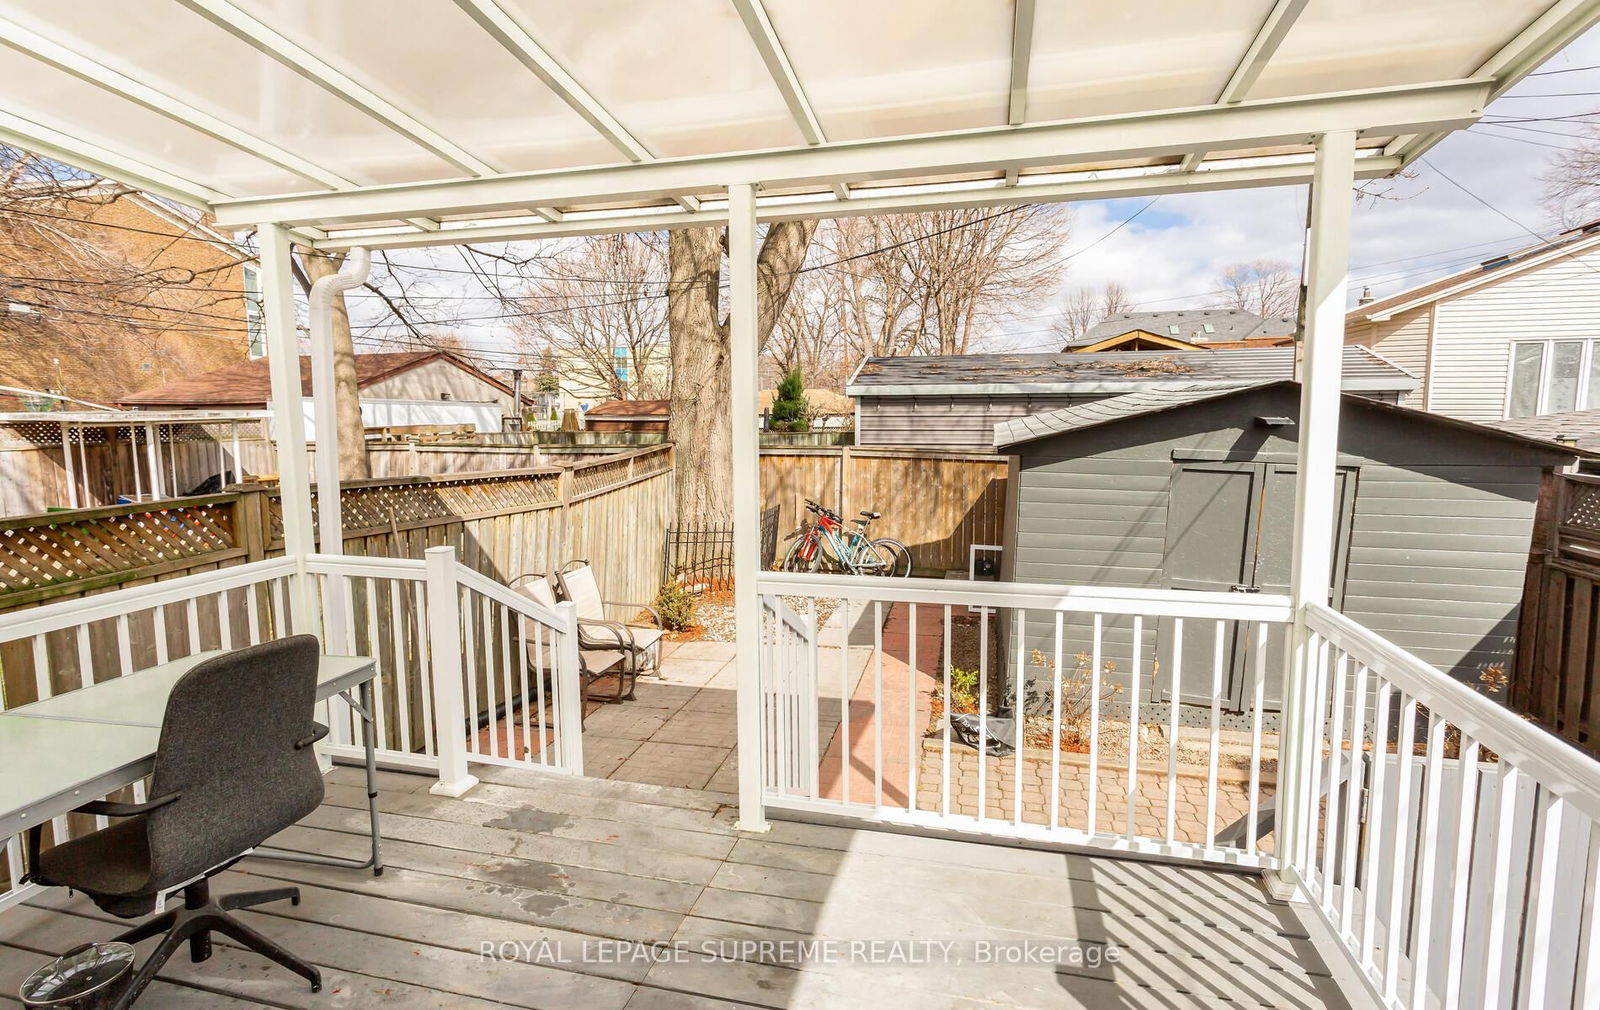
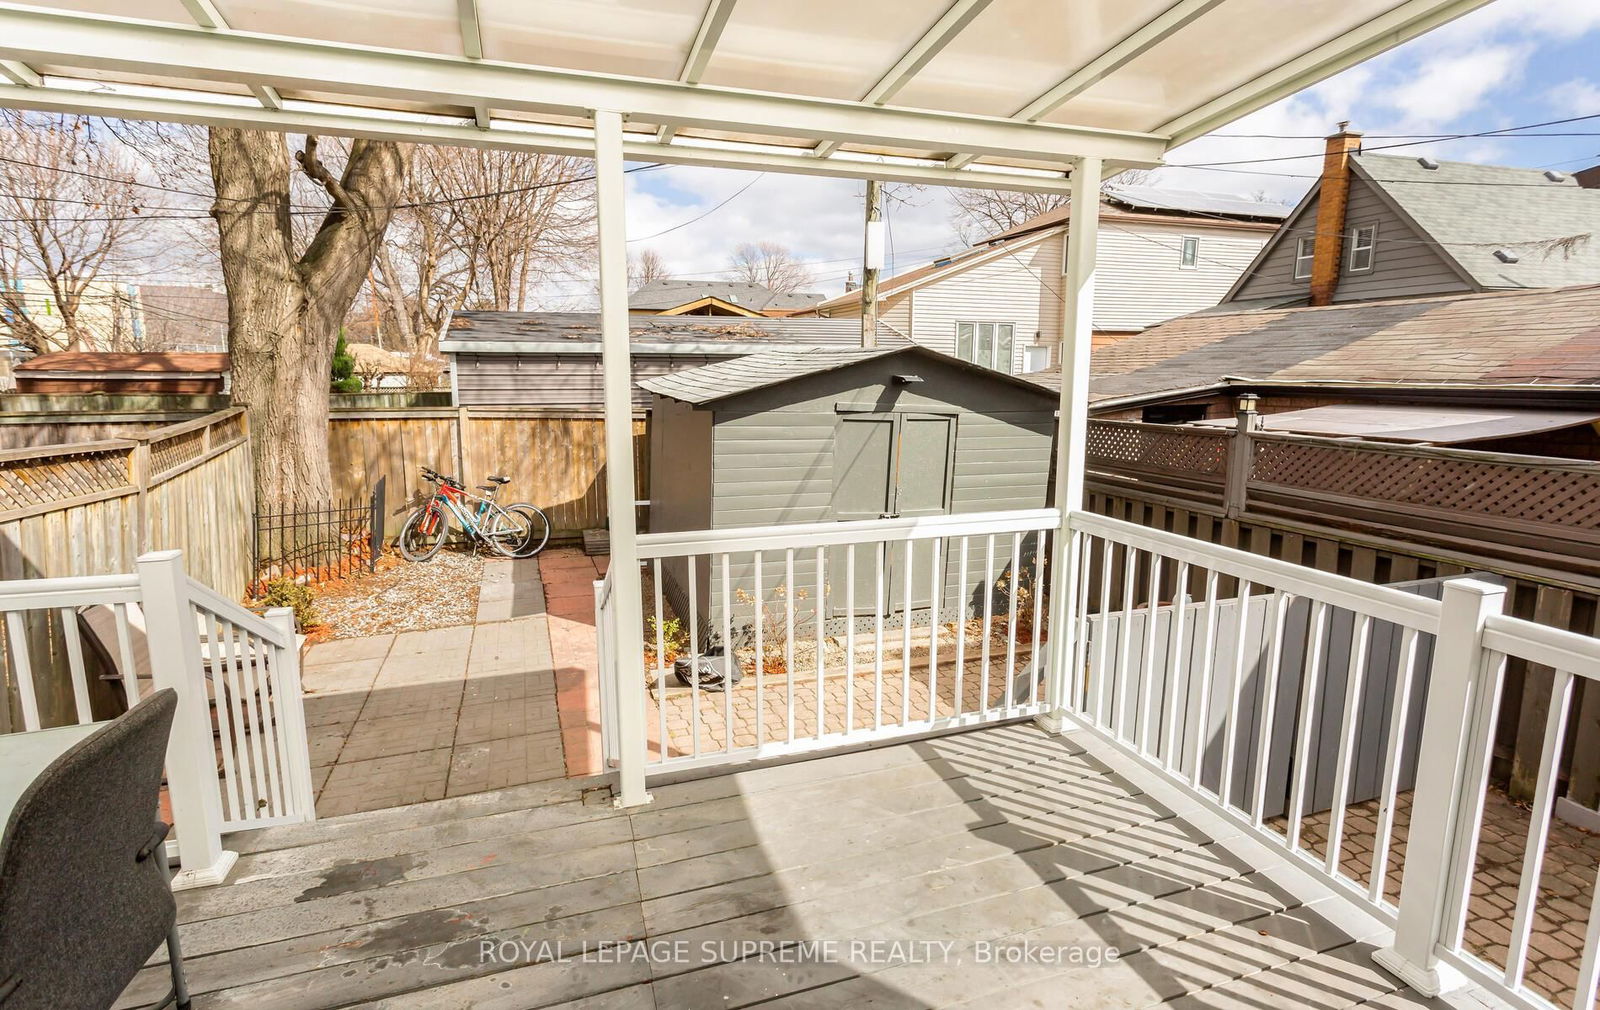
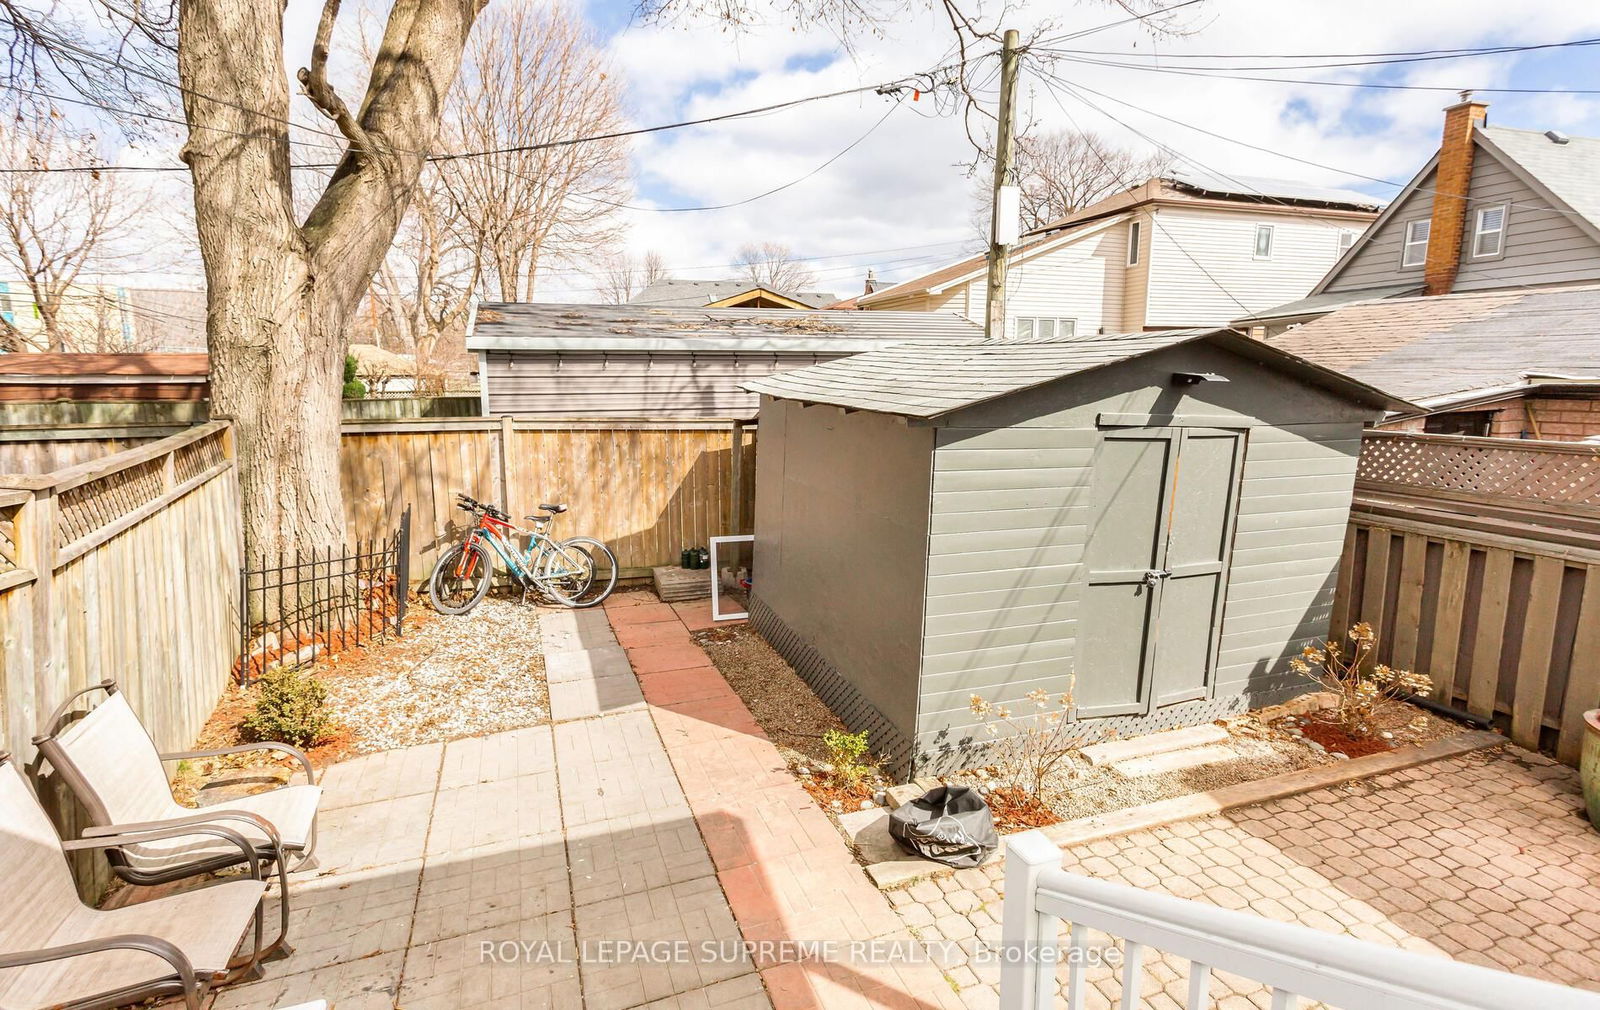
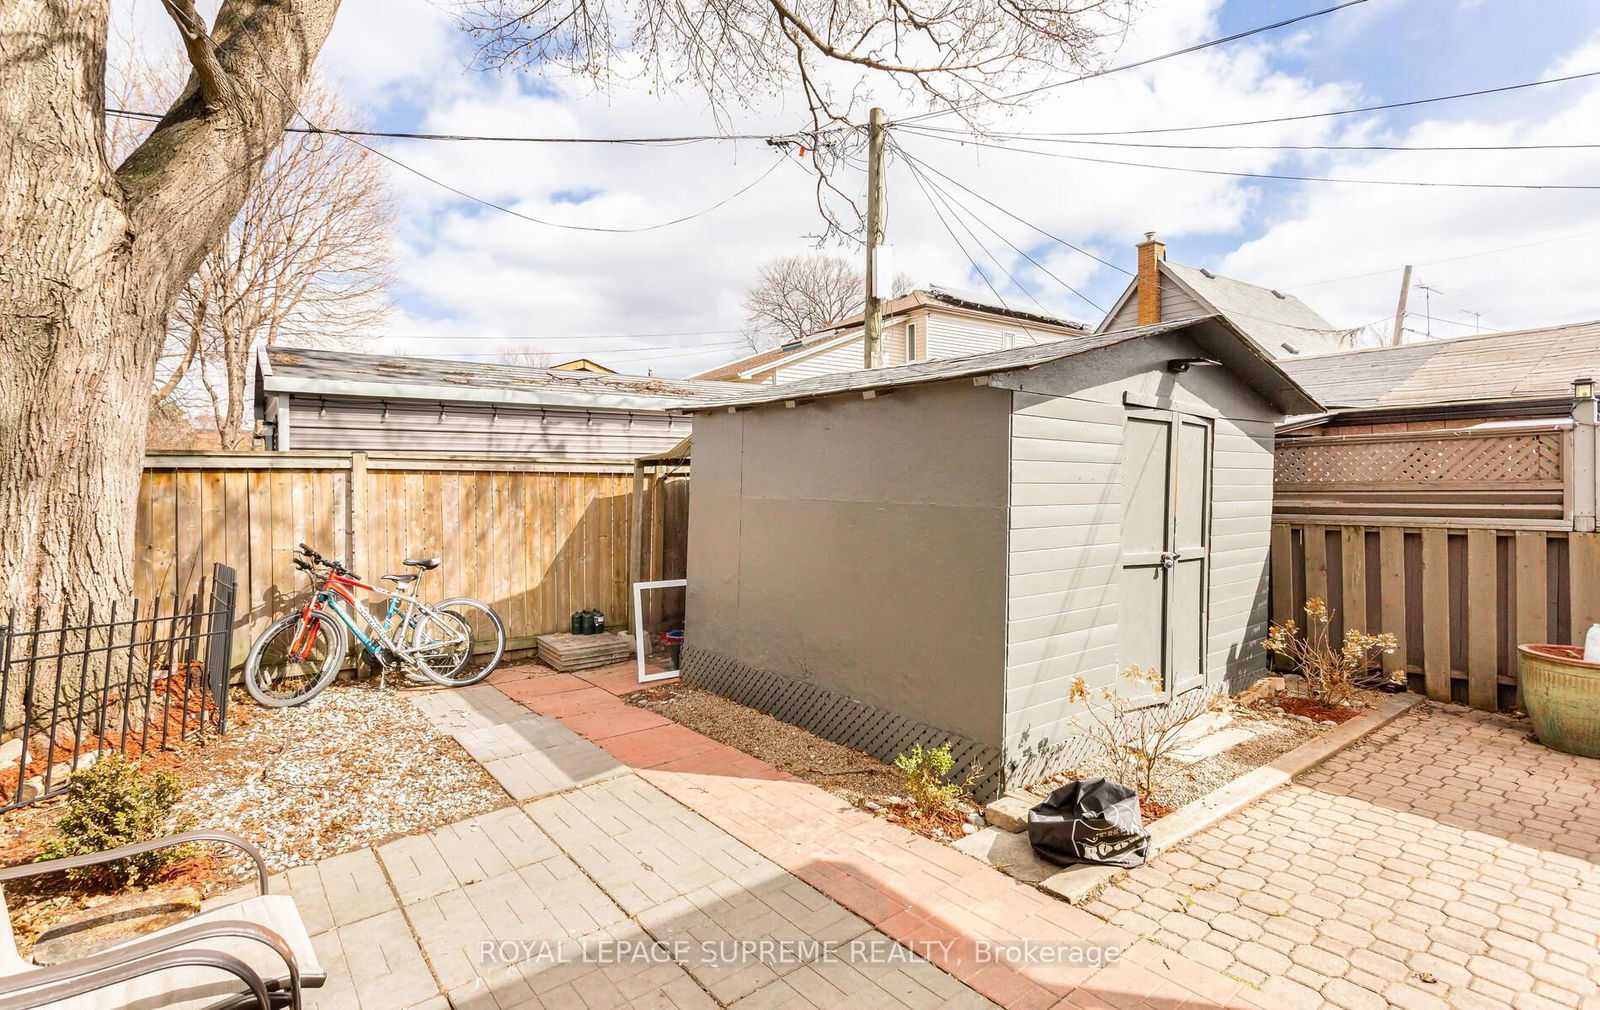
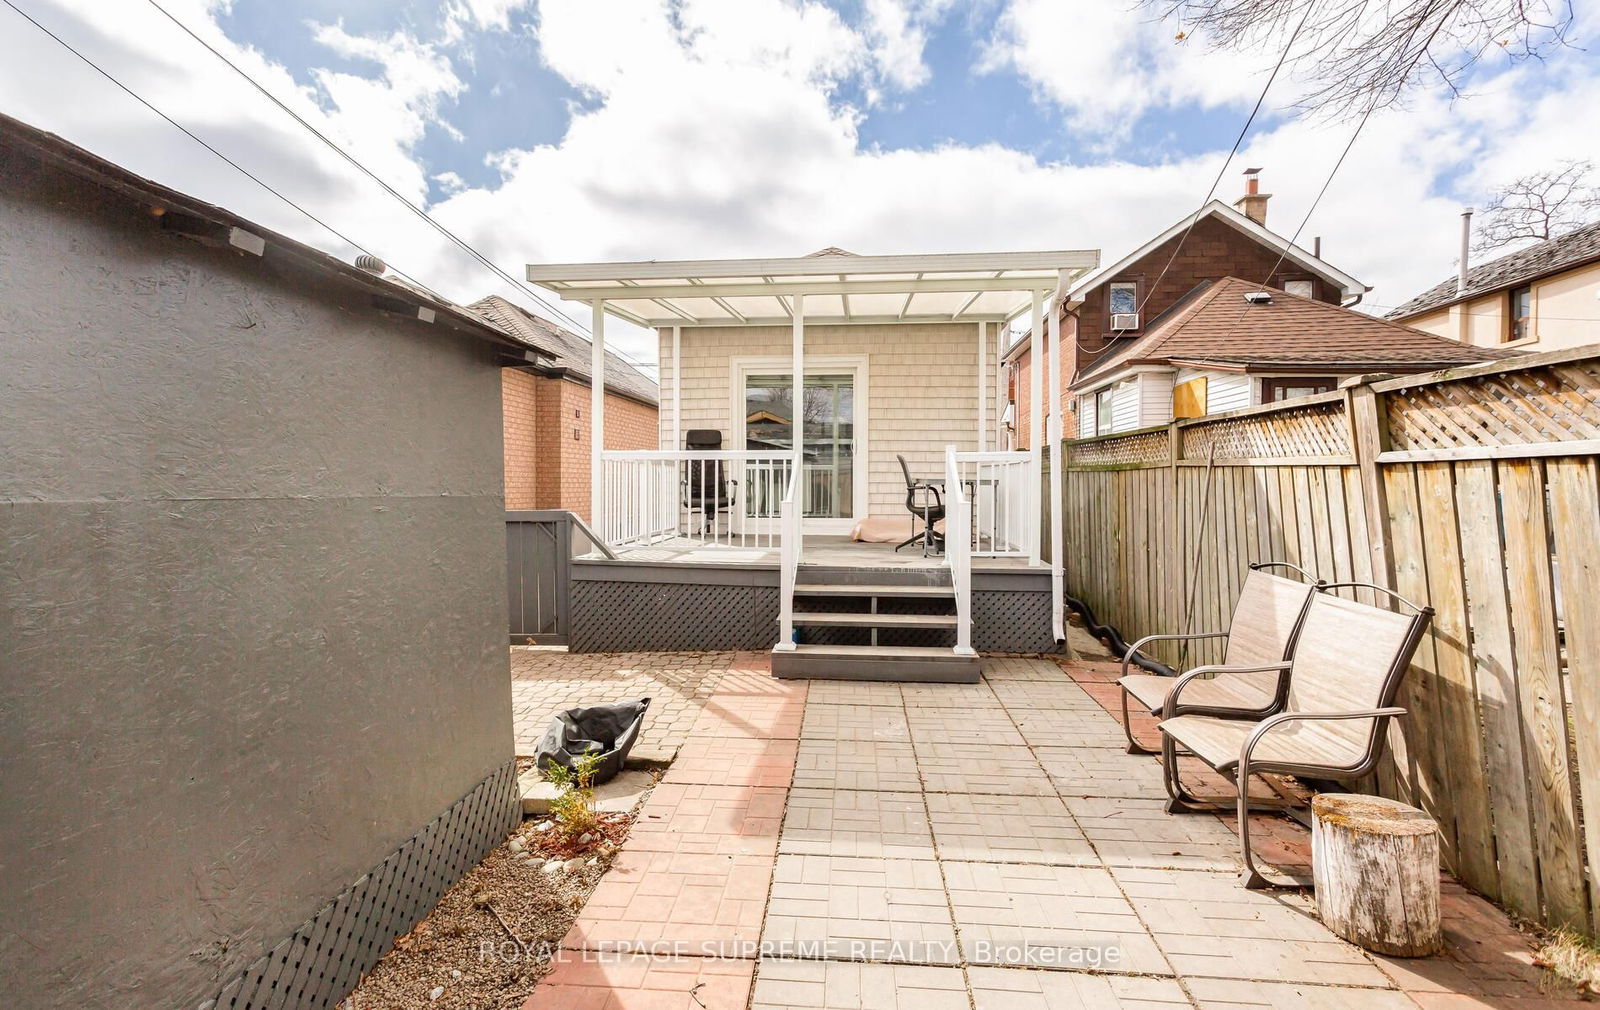
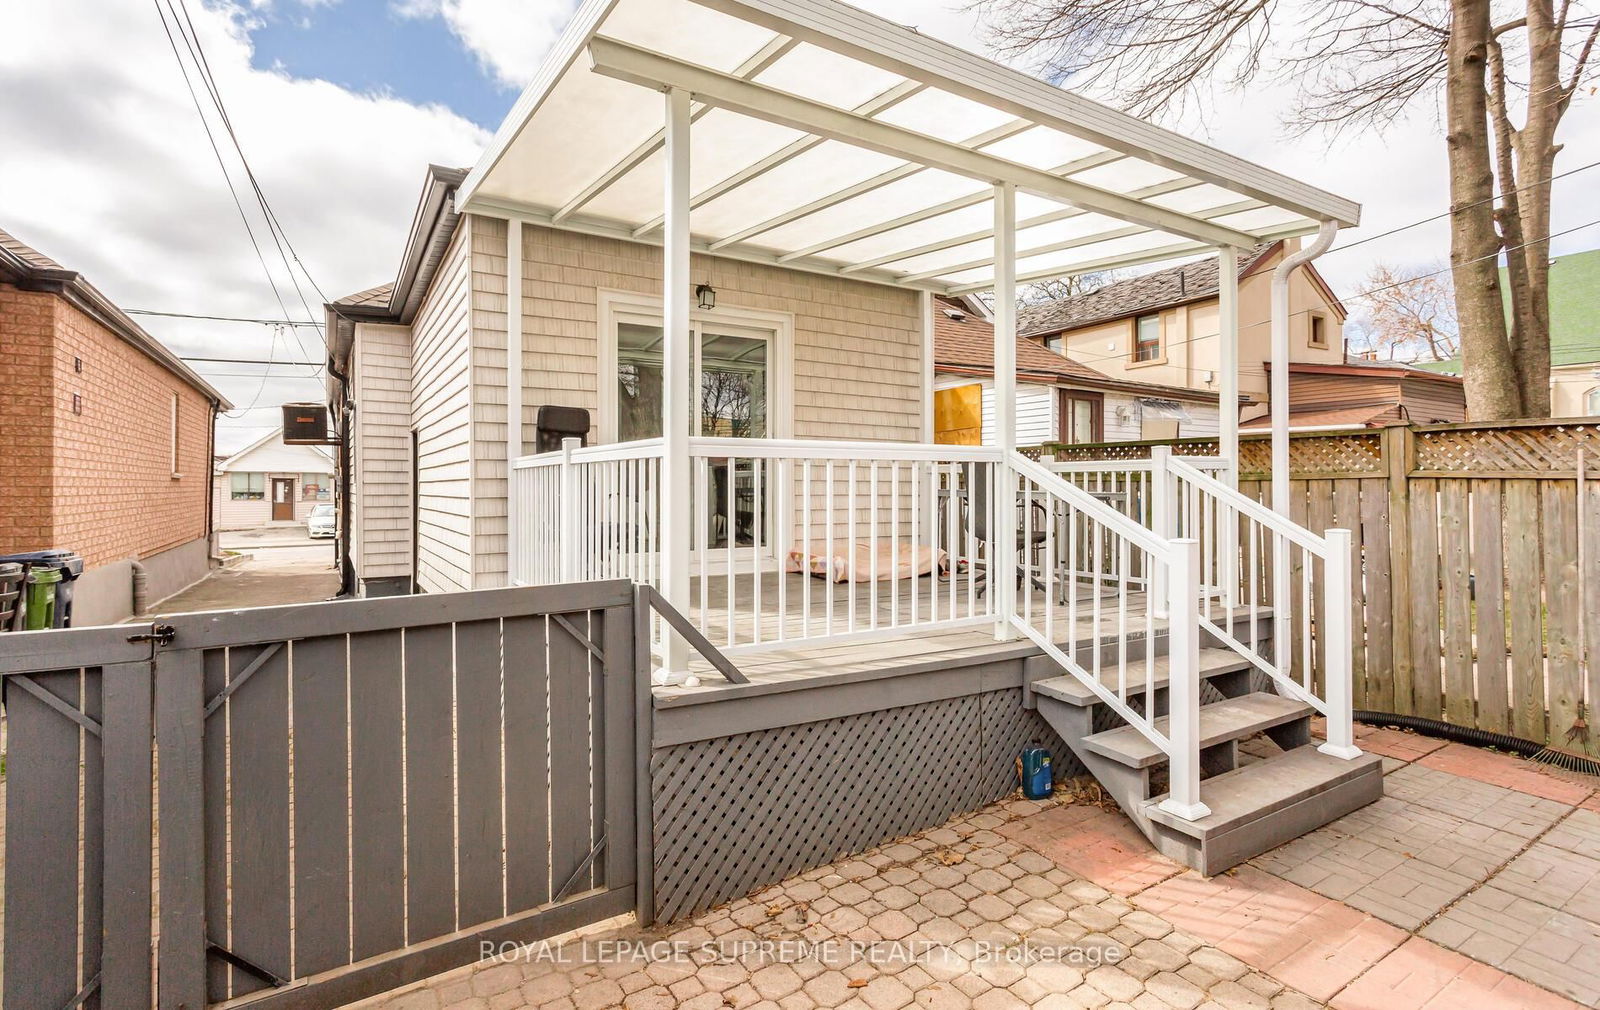
Welcome to 59 Guestville Ave! This beautifully renovated 2+1 bedroom detached bungalow combines charm, functionality, and incredible investment potential. The inviting front porch adds curb appeal, while the private backyard and dedicated parking space enhance convenience. Extensively upgraded with nearly $150,000 in improvements, this home features all-new flooring, windows, doors, bathrooms, and a modern kitchen with granite countertops, stainless steel appliances, and a functional island. The main floor offers a seamless walkout to a stunning deck and backyard perfect for entertaining. The fully finished basement apartment, complete with a brand-new kitchen, living area, bedroom, and private entrance, provides excellent income potential or an ideal in-law suite. The seller has successfully generated approximately $30,000 annually from the basement Airbnb rental over the past two years and is willing to leave it fully furnished for the new buyer. Additional upgrades include a new front deck, patio shed, and improvements to soffit, fascia, gutters, siding, and insulation. Conveniently located near schools, parks, public transit, and major highways, this home is just a short walk to the new Mount Dennis LRT station and offers easy access to the vibrant St. Clair and Bloor West areas. This move-in-ready home is a fantastic opportunity for first-time buyers or those seeking a condo alternative dont miss out!
Fridge, cooktop, wall oven, dishwasher island with 4 chairs .Basement fridge ,stove, Bed, Study table with chair basement couch and kitchen island with 3 chairs and all Elfs. Washer & Dryer.
Living
Kitchen
Br
2nd Br
Living
Kitchen
Br
The graph below compares the average list price and average sale price of homes in this neighborhood by month for the last 24 months. When average sale price is greater than average list price, this may suggest a buyer's market. When average sale price is lower than the average list price this may suggest a seller's market.
The graph below illustrates the average days on market for homes in this neighborhood. The yellow area may indicate a buyer's market, the green area may indicate a balanced market and the red area may indicate a seller's market.
Sales Representative, Century 21 People’s Choice Realty Inc., Brokerage
(647) 576 - 2100
Toronto, Keelesdale-Eglinton West, M6N 3B8
Toronto, Brookhaven-Amesbury, M6M 2S6